


August 6, 2026 Detective Quantum Efficiency: The True Measure of a Dental Sensor, Beyond Resolution
Read any dental sensor’s brochure and the number that leads the page is resolution: line pairs per millimetre, the finest set of alternating lines the detector can still hold apart before they blur into grey. It is a satisfying figure, and it is not wrong. But it describes a sensor at its theoretical best — flooded with photons, contrast maximal, noise irrelevant. It is the imaging equivalent of a car’s top speed: real, printed proudly, and almost never the number that matters on the road.
The number that matters on the road is detective quantum efficiency — DQE — and it asks a harder, more honest question. Not how fine a line can you draw, but how much of the information in the X-ray beam does this detector actually keep? A perfect sensor would preserve all of it: every photon that struck it would contribute cleanly to the picture. Real sensors leak. DQE measures exactly how much, and it is the closest thing dental imaging has to a single, unsparing measure of a detector’s worth.
What the Number Actually Means
Formally, DQE is the ratio of the squared signal-to-noise at the detector’s output to the squared signal-to-noise carried in by the X-ray beam. It runs from 0 to 1 — or, more usefully, from 0% to 100%. A DQE of 1 would be a flawless detector that adds no noise and loses no signal. Nothing achieves it. What a good intraoral sensor achieves is a respectable fraction: one highly-integrated dental sensor characterised in the research literature measured a DQE of roughly 0.8 at 40 keV — meaning that even at its best, a fifth of the beam’s information was simply lost.
The reason DQE is more honest than resolution is that it folds three things into one figure. It contains the signal the detector transfers (its modulation transfer function, the MTF that resolution charts describe). It contains the noise the detector adds (its noise power spectrum, the NPS). And it contains the detector’s raw efficiency at catching photons at all. Resolution reports only the first. DQE reports the bargain struck between all three — which is why the same 2014 review that pressed dentistry toward higher quantum efficiency treated DQE, not line pairs, as the field’s real frontier.
Why Two Sensors With the Same Resolution Are Not Equal
Here is the practical heart of it. Put two intraoral sensors on the bench, both rated at, say, 14 line pairs per millimetre. On a high-dose test pattern they look like twins. Now halve the exposure — the direction every clinic wants to move, toward lower patient dose — and they diverge. The sensor with the higher DQE holds its image together; the incipient lesion at the edge of the greyscale stays visible. The sensor with the lower DQE dissolves into mottle, because it was spending photons it could not afford, and at half the dose the account is overdrawn.
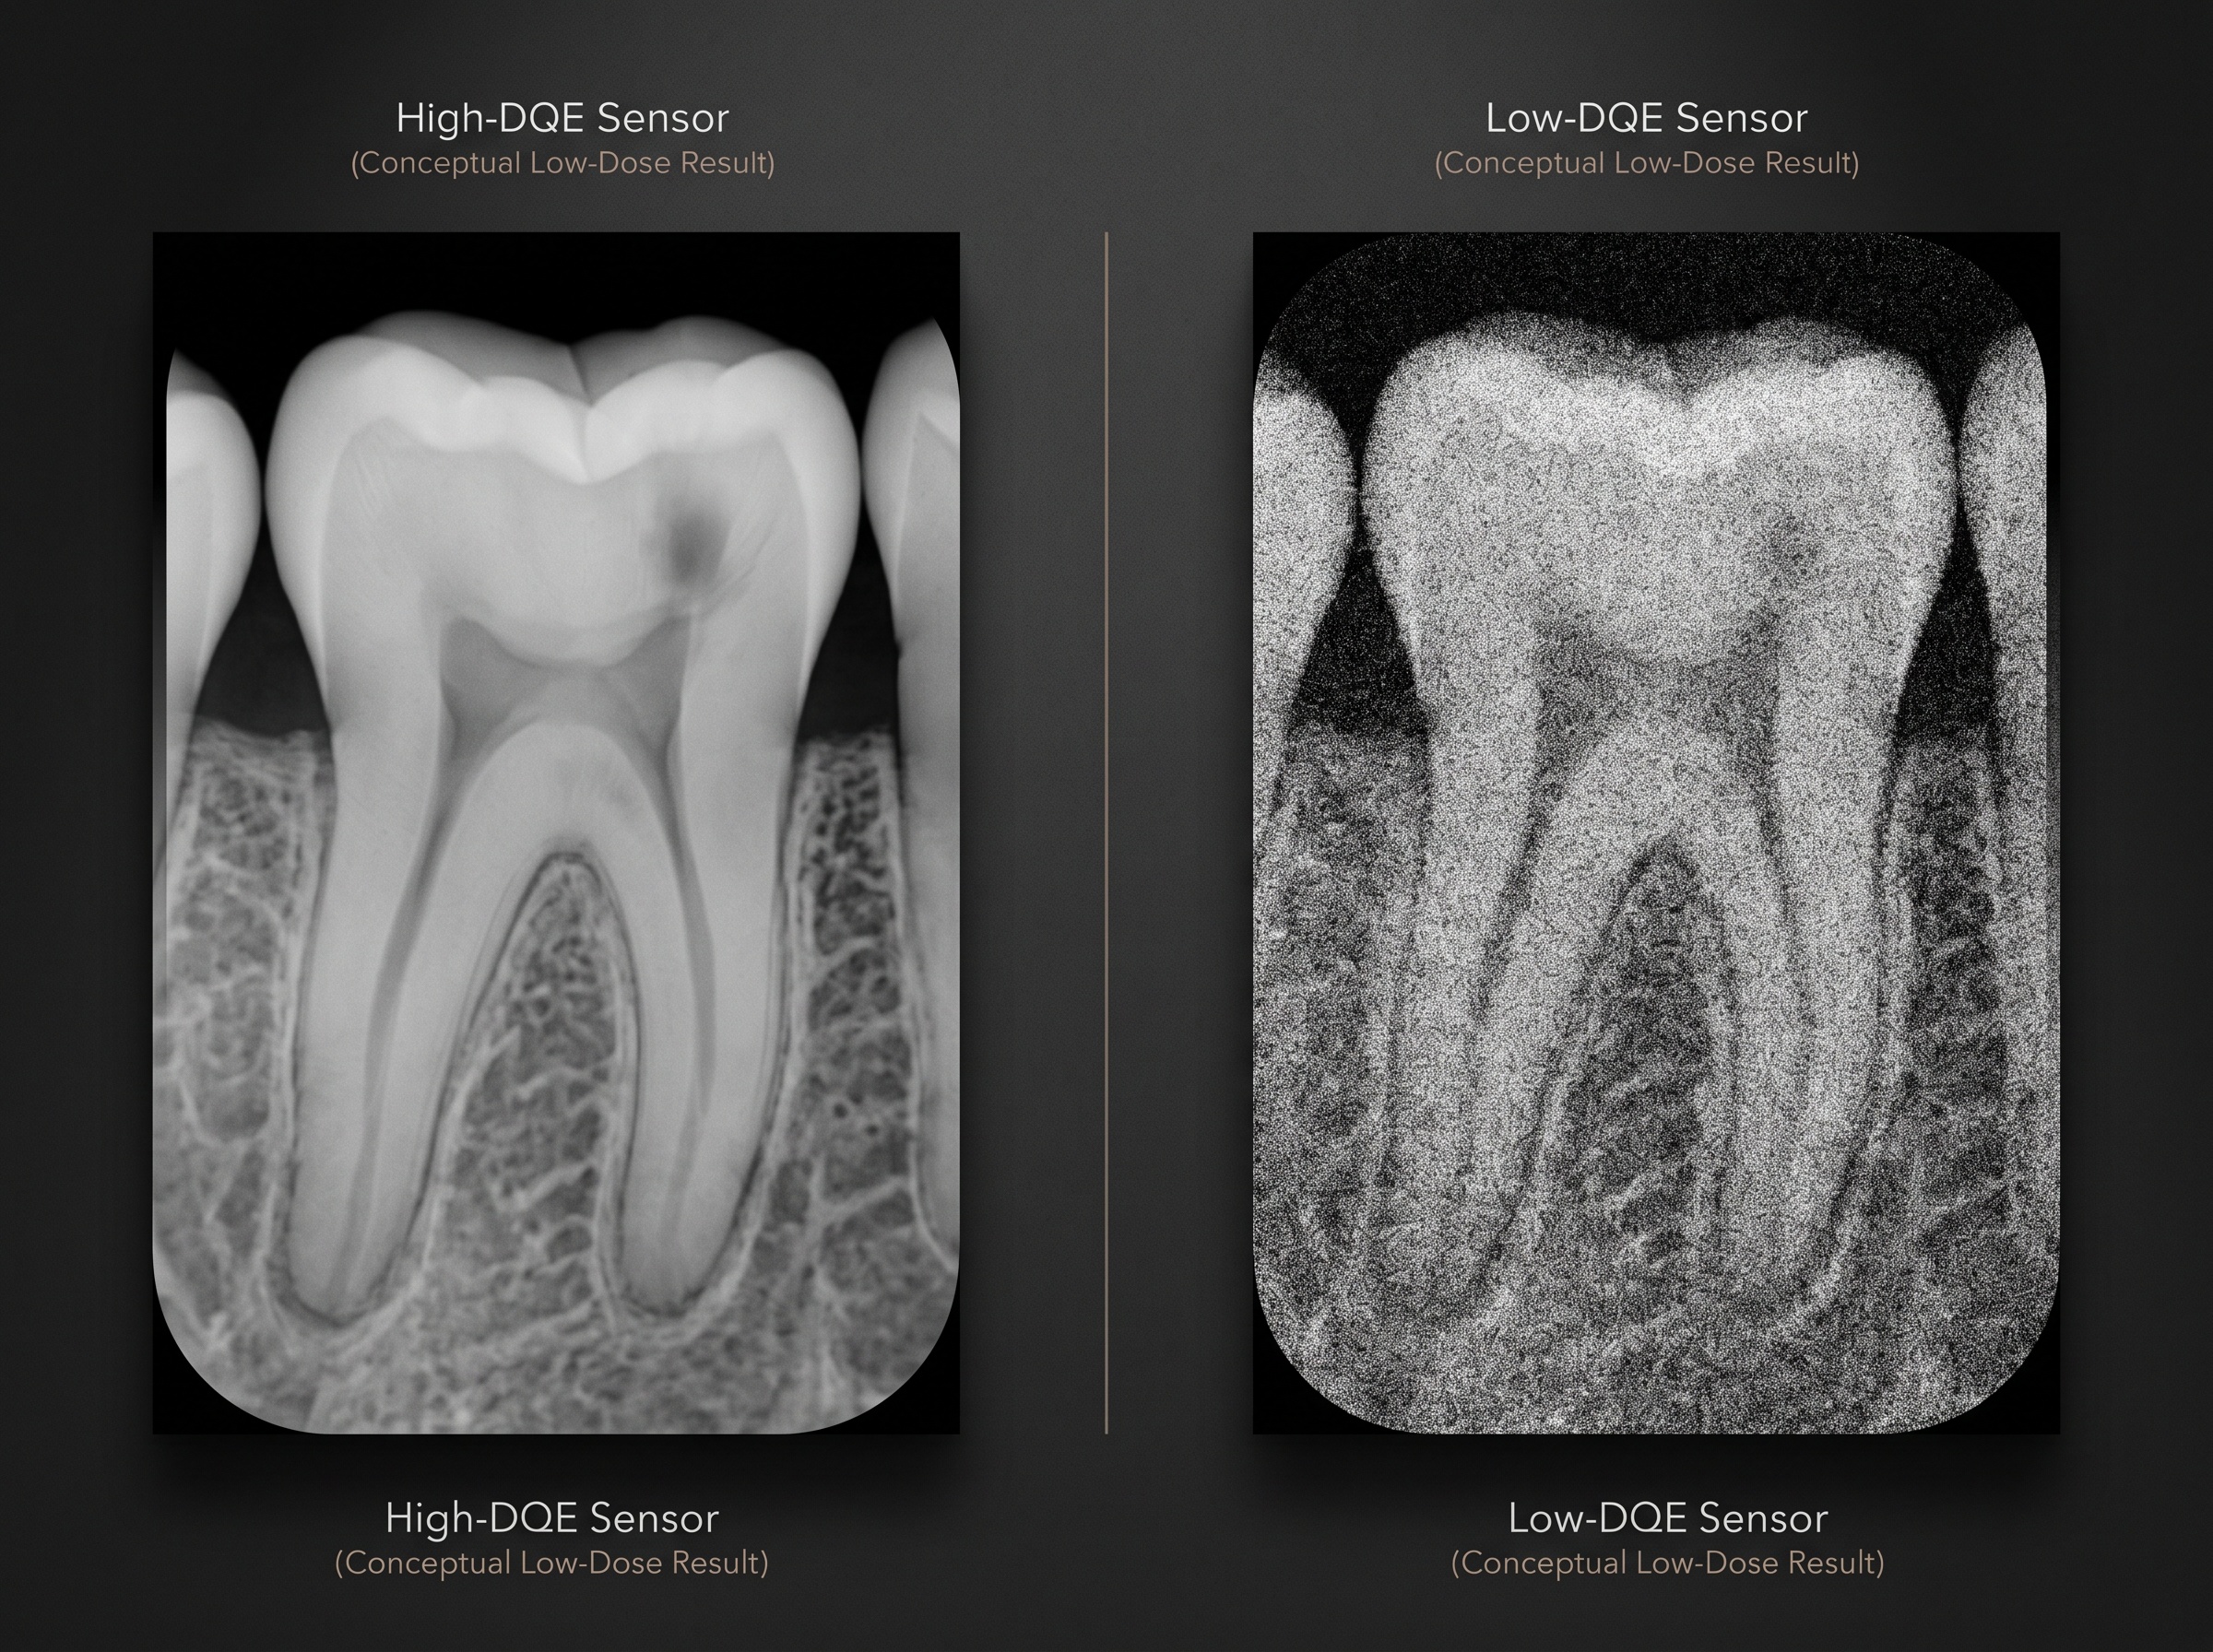
This is why DQE is fundamentally a dose statement disguised as a quality statement. A detector with high DQE gives you the same diagnostic image for less radiation, or a better image for the same radiation. In a discipline governed by ALARA — as low as reasonably achievable — that is not an academic nicety. It is the entire game. Resolution tells you the ceiling; DQE tells you what the image is worth at the dose you will genuinely use on a genuine patient, day after day.
Where the Information Leaks
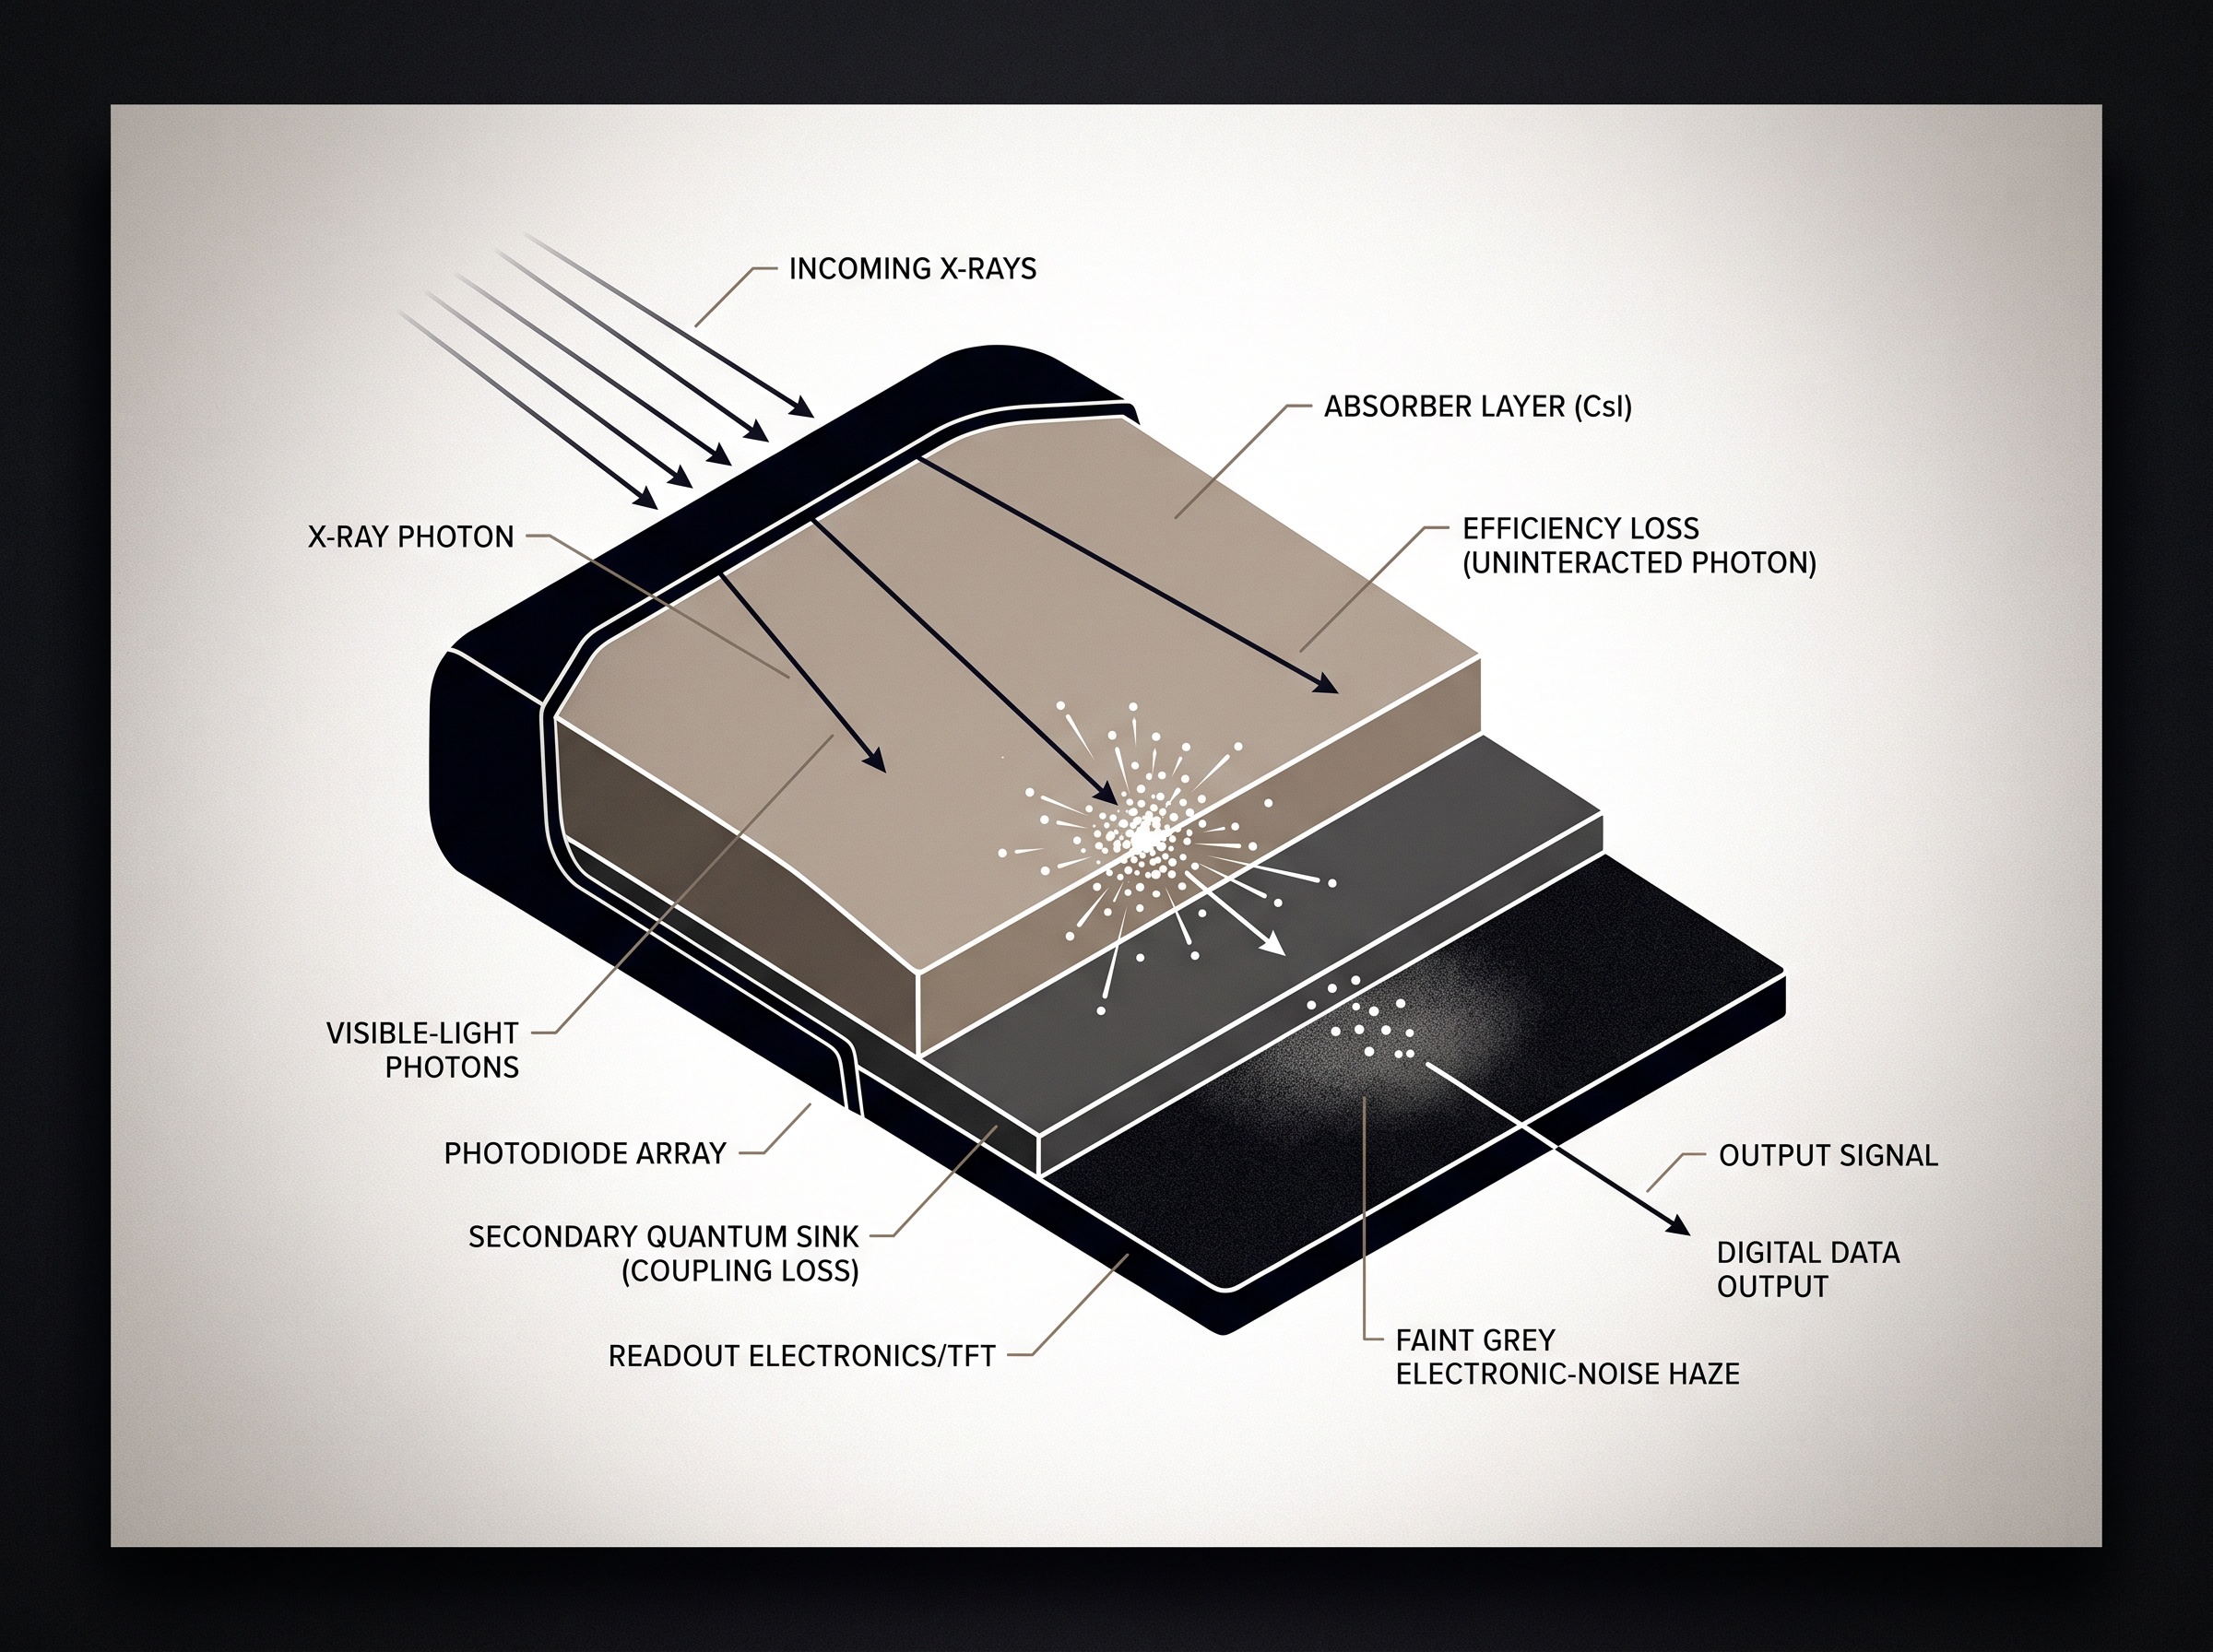
To respect DQE is to understand where a detector bleeds information. The first loss is at the front door: quantum efficiency proper — the fraction of arriving X-rays the sensor actually absorbs rather than passing through. A scintillator or semiconductor too thin to catch the beam throws away information before the electronics ever see it, and no downstream cleverness recovers a photon that was never stopped.
The second loss is the secondary quantum sink — a subtle, unforgiving trap. In indirect sensors, an absorbed X-ray becomes a burst of visible-light photons in the scintillator, and only some of those reach the photodiode. If too few make the trip, that stage becomes the new bottleneck, and its statistical noise dominates everything after. The third loss is additive electronic noise — dark current, read noise — the grey haze that sits under every exposure and swamps the faintest signals first. DQE is the single figure that accounts for all three at once, across every spatial frequency, which is precisely why it resists the flattery that a lone resolution number invites.
Reading DQE Like a Curve, Not a Headline
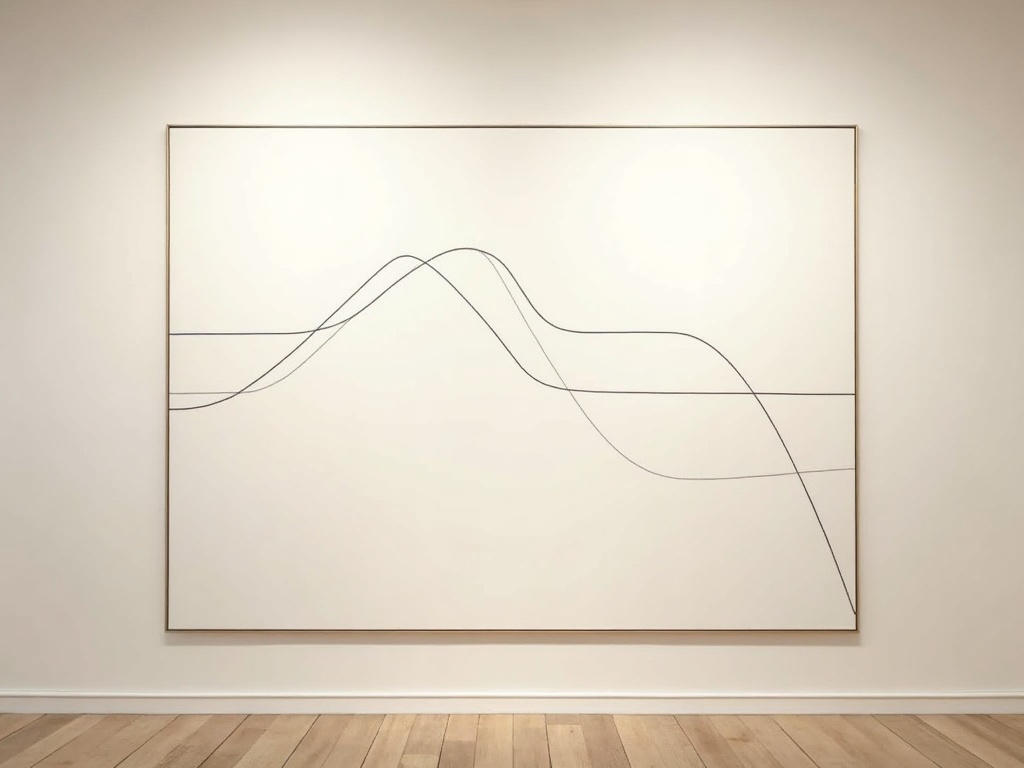
DQE is rarely one number; it is a curve plotted against spatial frequency. It typically starts highest at low frequencies — the broad, low-contrast structures, the bone-density gradients and soft shadows where subtle pathology hides — and falls as it climbs toward fine detail. This shape carries a quiet lesson. A detector can be excellent at rendering hairline-fine edges yet mediocre at the low-frequency, low-contrast task of revealing a faint periapical rarefaction, or the reverse.
So the sophisticated question is never “what is its DQE?” but “what is its DQE at the frequencies my diagnosis depends on?” Caries detection lives in a different band of the curve than measuring the margin of a crown. Reading the whole curve, rather than a single boasted peak, is the difference between choosing a sensor by its marketing and choosing it by its physics.
From Bench Metric to Clinical Judgement
None of this asks the clinician to run noise-power spectra between patients. It asks something simpler and more durable: a healthy scepticism toward the resolution figure on the box, and a preference for detectors whose manufacturers publish DQE curves at diagnostic doses — because the ones with nothing to hide tend to show their work. When comparative studies characterise intraoral detectors across beam qualities and spatial frequencies, as a 2025 analysis did across multiple current sensors, they are formalising exactly the instinct a careful clinician already has: that the sensor which still gives a clean, readable image at low dose is the better instrument, whatever its top-line resolution claims.
Future Developments
The trajectory of dental imaging can be read as a long campaign to raise DQE — to keep more of every photon’s information and waste less of every patient’s dose. Thicker, higher-atomic-number absorbers to catch more of the beam; direct-conversion semiconductors that skip the leaky light-conversion stage and its secondary quantum sink; photon-counting front-ends that refuse to count electronic noise at all, lifting DQE toward its physical ceiling. Each advance is, at bottom, a DQE story told in different materials. As these mature, expect specification sheets to lead less with resolution and more with dose-efficiency curves — and expect the clinicians who understand the difference to spend their patients’ radiation with a craftsman’s care. The finest image, here as always, is the one that tells the most truth for the least cost; detective quantum efficiency is simply how we measure that grace.
Sources & further reading:
- Detective quantum efficiency (Wikipedia)
- Mistry et al., Low Dose X-Ray Sources and High Quantum Efficiency Sensors: The Next Challenge in Dental Digital Imaging? (Radiology Research and Practice, 2014)
- Characterization of intraoral digital detectors: comparative analysis in spatial and reciprocal domains (Radiation Physics and Chemistry, 2025)
Sorry, the comment form is closed at this time.