


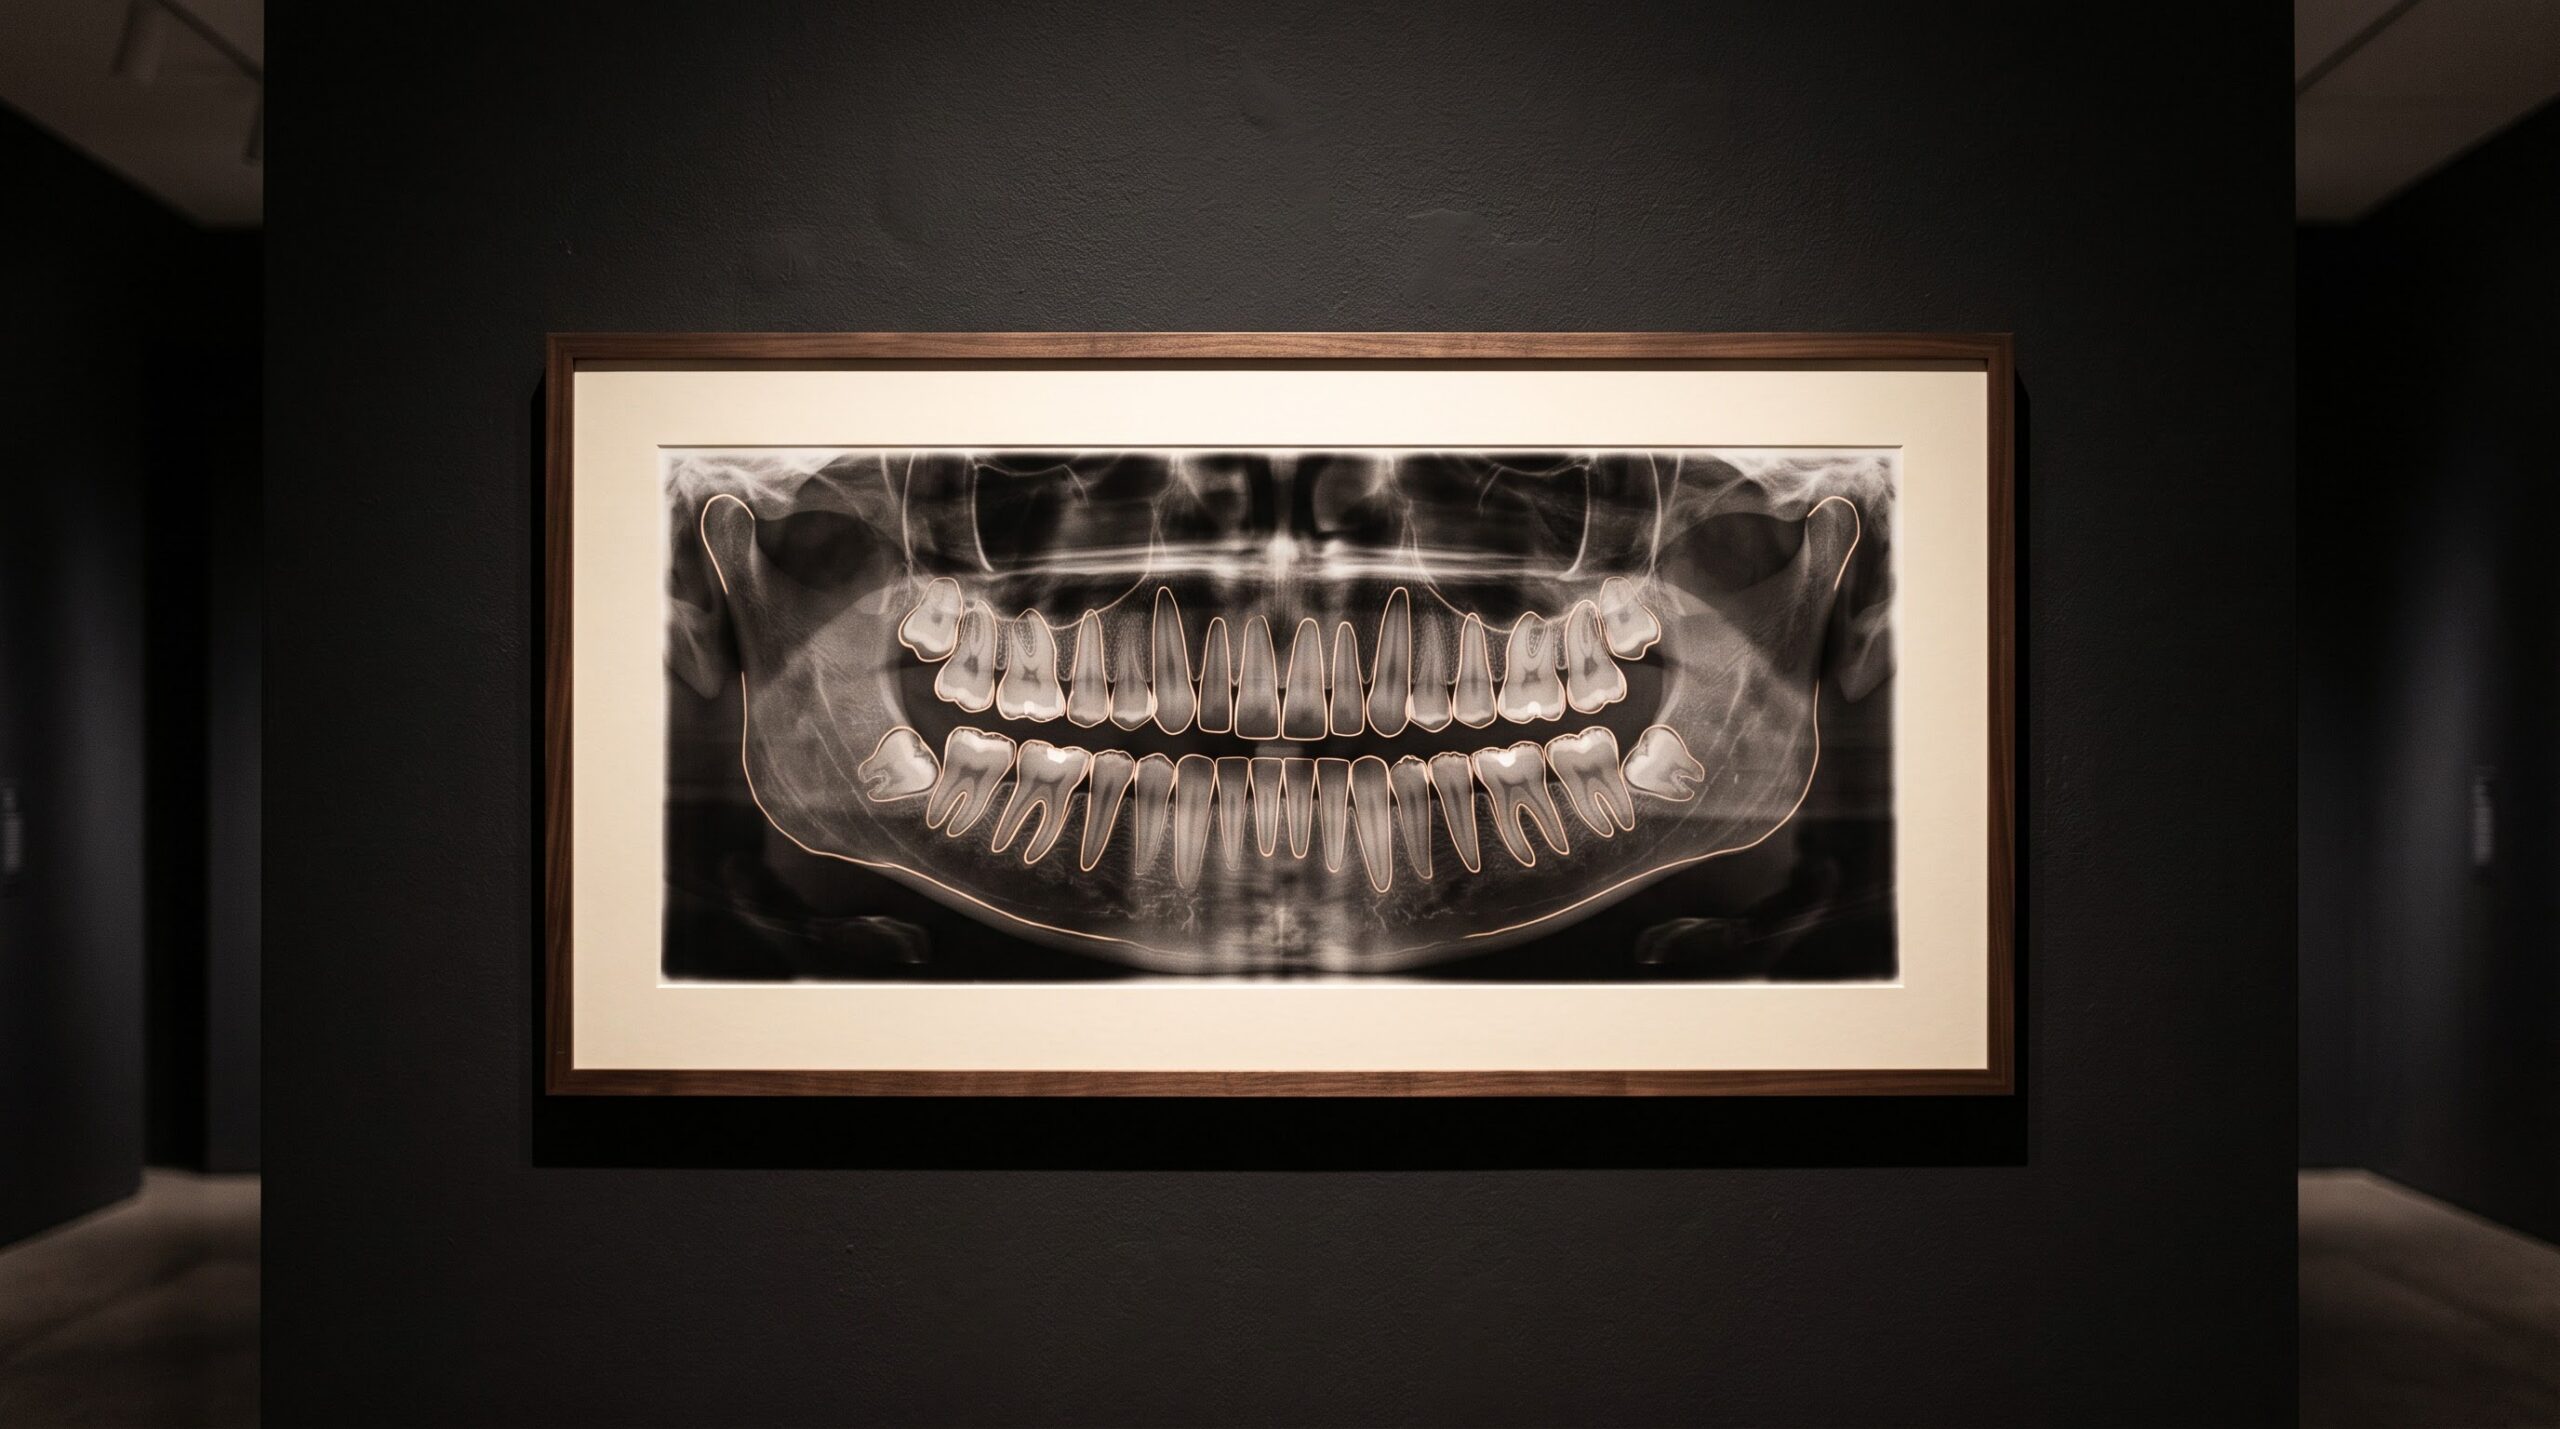
November 18, 2026 Naming Every Tooth: AI Auto-Charting, Segmentation, and the Annotated Radiograph
Every conversation about artificial intelligence in dental imaging rushes toward the verdict — the flagged lesion, the measured bone loss, the second opinion rendered in milliseconds. But before any model can make a claim about a radiograph, it must first do something far humbler and far older: it must know which tooth it is looking at, and where that tooth ends. Naming the teeth and drawing their borders is the first act of every chart ever made, performed by hand and under the breath in operatories for a century. Teaching a machine to do it is the quiet groundwork beneath every headline, and it deserves to be looked at on its own terms.
The task has a plain name in the imaging literature — detection, numbering and segmentation — and an unglamorous purpose. It turns a flat field of grays into a structured record in which each tooth is a discrete, named object with a traced outline. Only once the image is labeled this way can anything else be anchored to it: a finding attached to tooth 36 rather than to a smudge in the lower left, a comparison made tooth-by-tooth across two visits, a report that a records system can actually read.
From a picture to a record
A radiograph, to a computer, begins as nothing but a grid of brightness values. It has no concept of a tooth, let alone a second molar. Auto-charting imposes a coordinate system of meaning on that grid: it locates each tooth, assigns it a notation number under a standard scheme such as FDI or the Universal numbering system, and — through instance segmentation — traces the pixel border that separates one tooth from its neighbors and from the bone around it. The output is not a prettier image but a different kind of object entirely: an addressable map of the dentition.
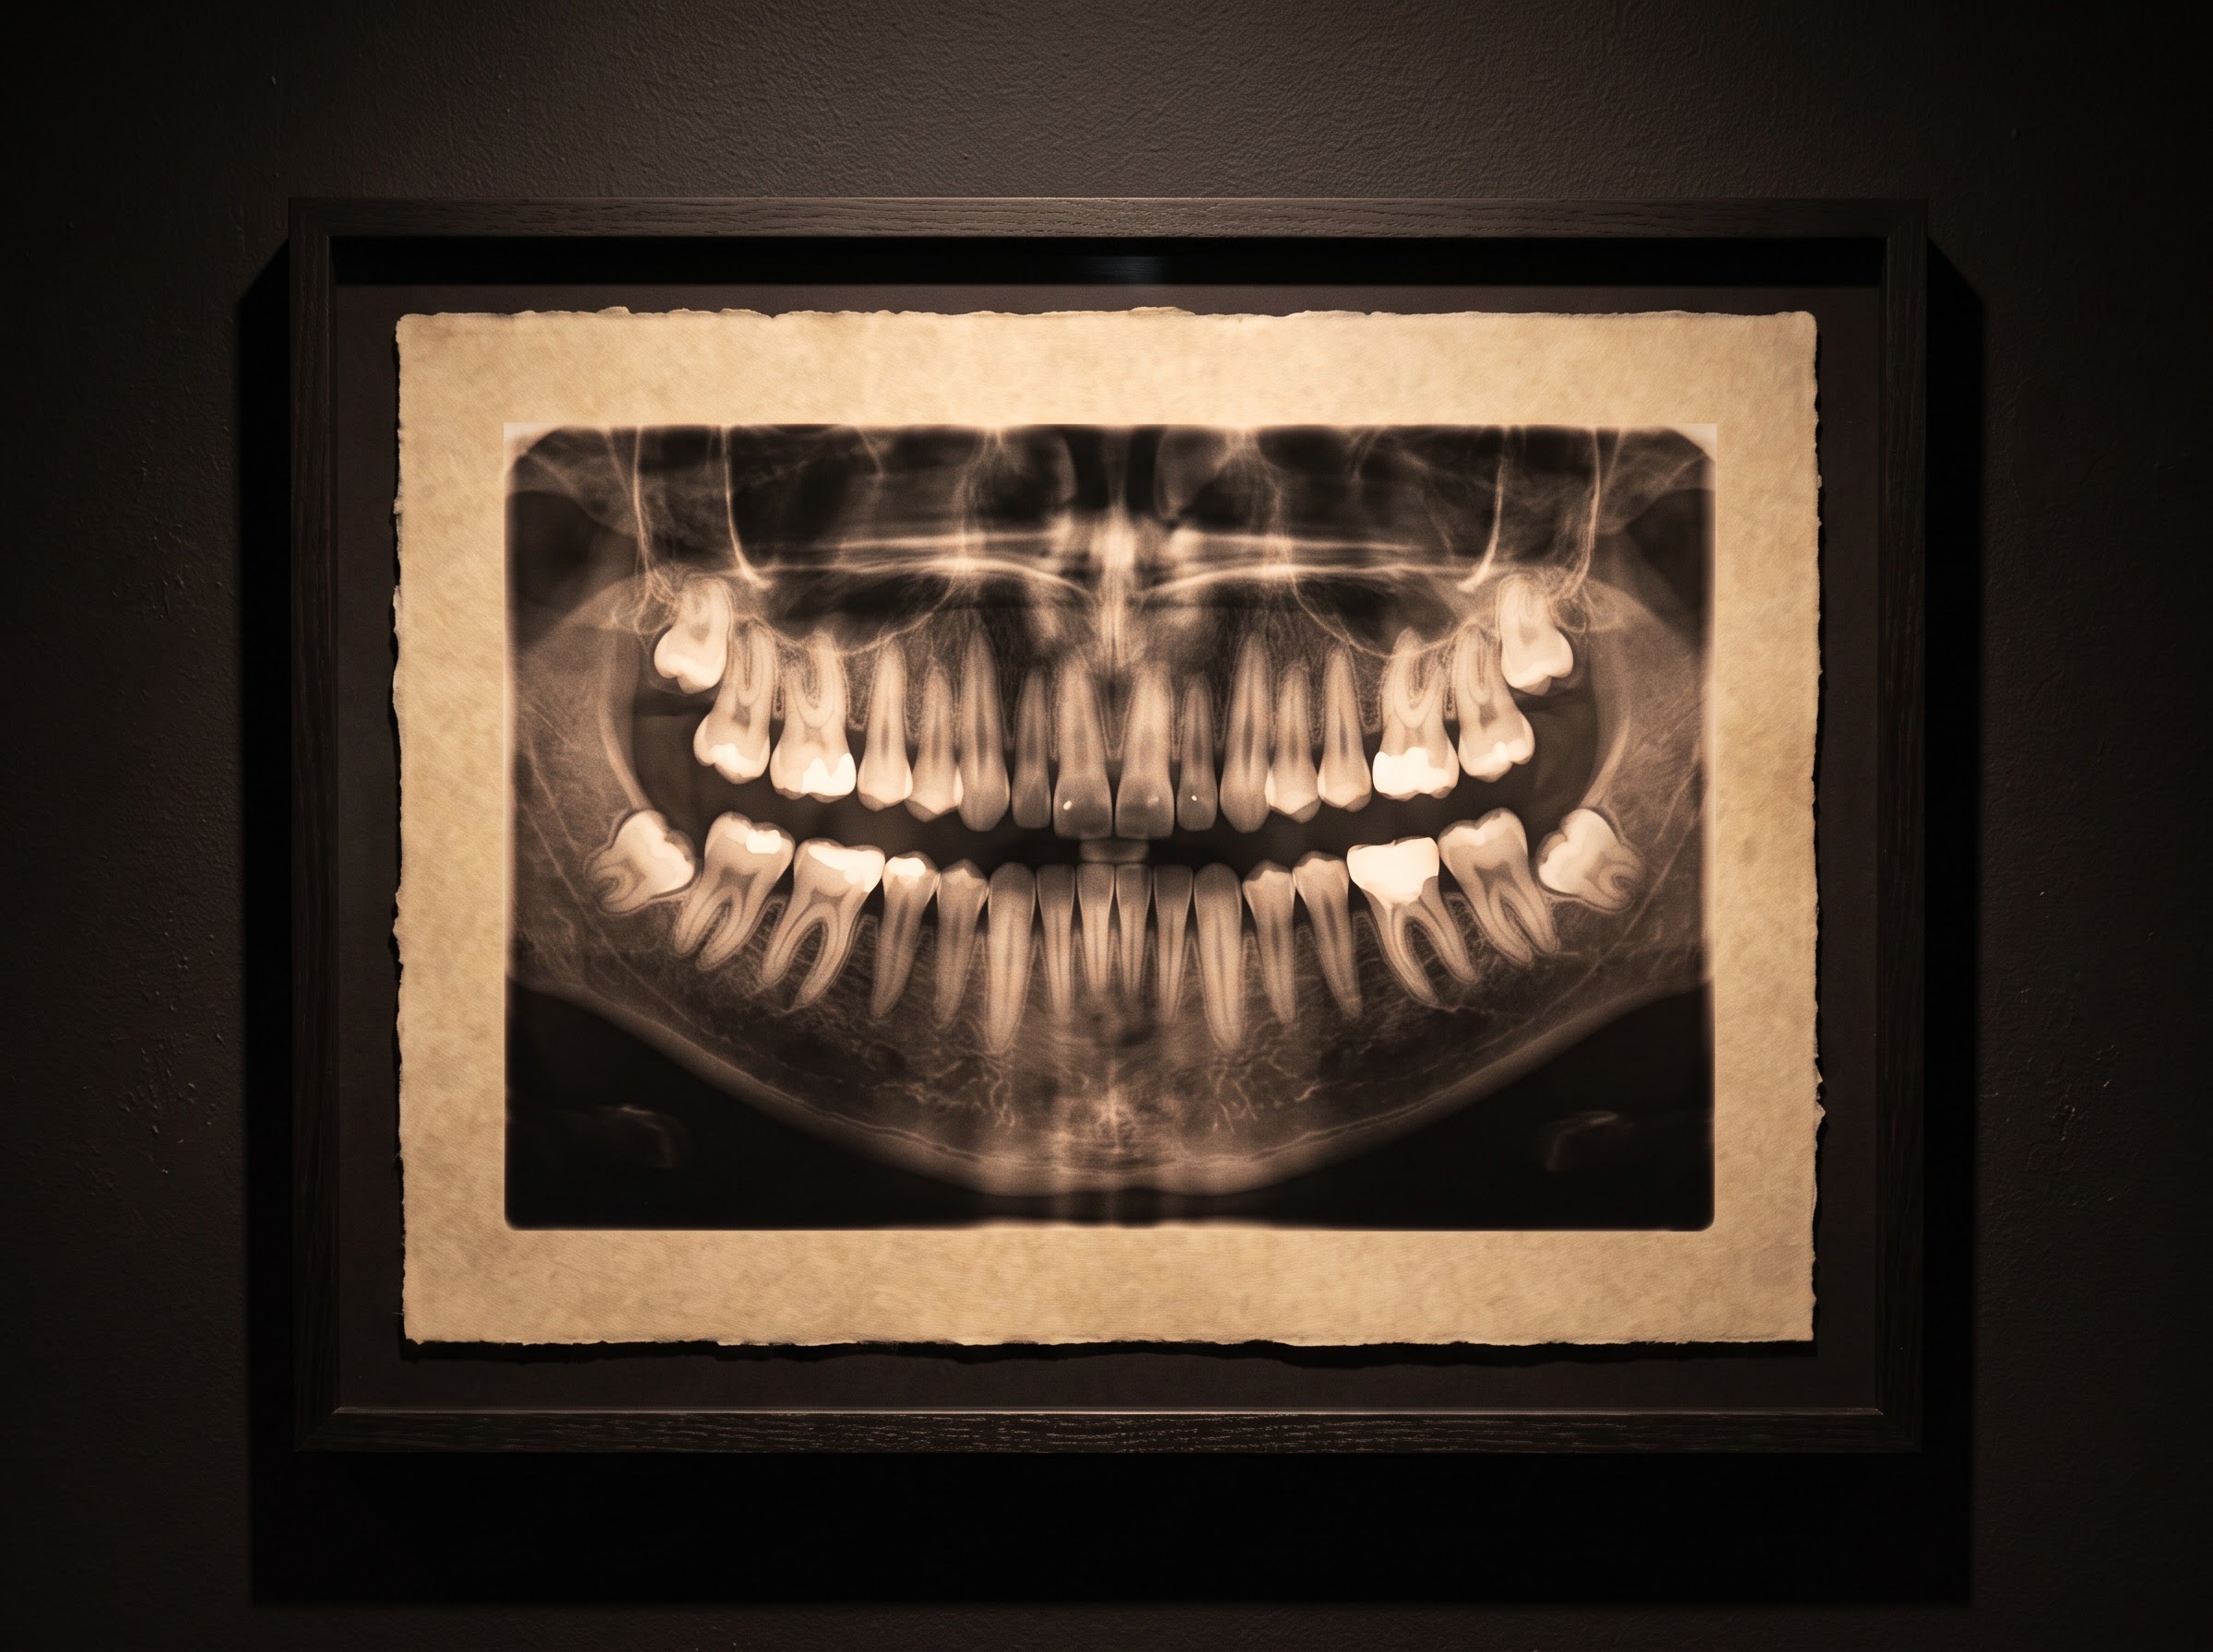
That shift, from picture to record, is the whole point. A human clinician performs it so automatically that its difficulty is invisible, but it is precisely the step that makes everything downstream possible. This is the same logic that governs how a model reads an image in the first place — the meaning it extracts depends entirely on the structure it can impose, a theme we developed in why one algorithm reads the intraoral x-ray, panoramic and CBCT so differently. Charting is where that structure is first laid down.
Why segmentation is the hard part
Detecting that a tooth exists somewhere in an image is comparatively easy. Drawing the exact line between two teeth that touch, overlap on a bitewing, or lean into one another in a crowded arch is not. Instance segmentation has to commit to a boundary where enamel presses against enamel and the radiographic densities blur together — and it has to do so for each tooth individually, keeping them distinct rather than merging a contact point into a single blob. The difference between a model that can say “there are teeth here” and one that can hand back thirty-two cleanly separated, individually numbered objects is enormous, and it is where most of the engineering effort actually lives.
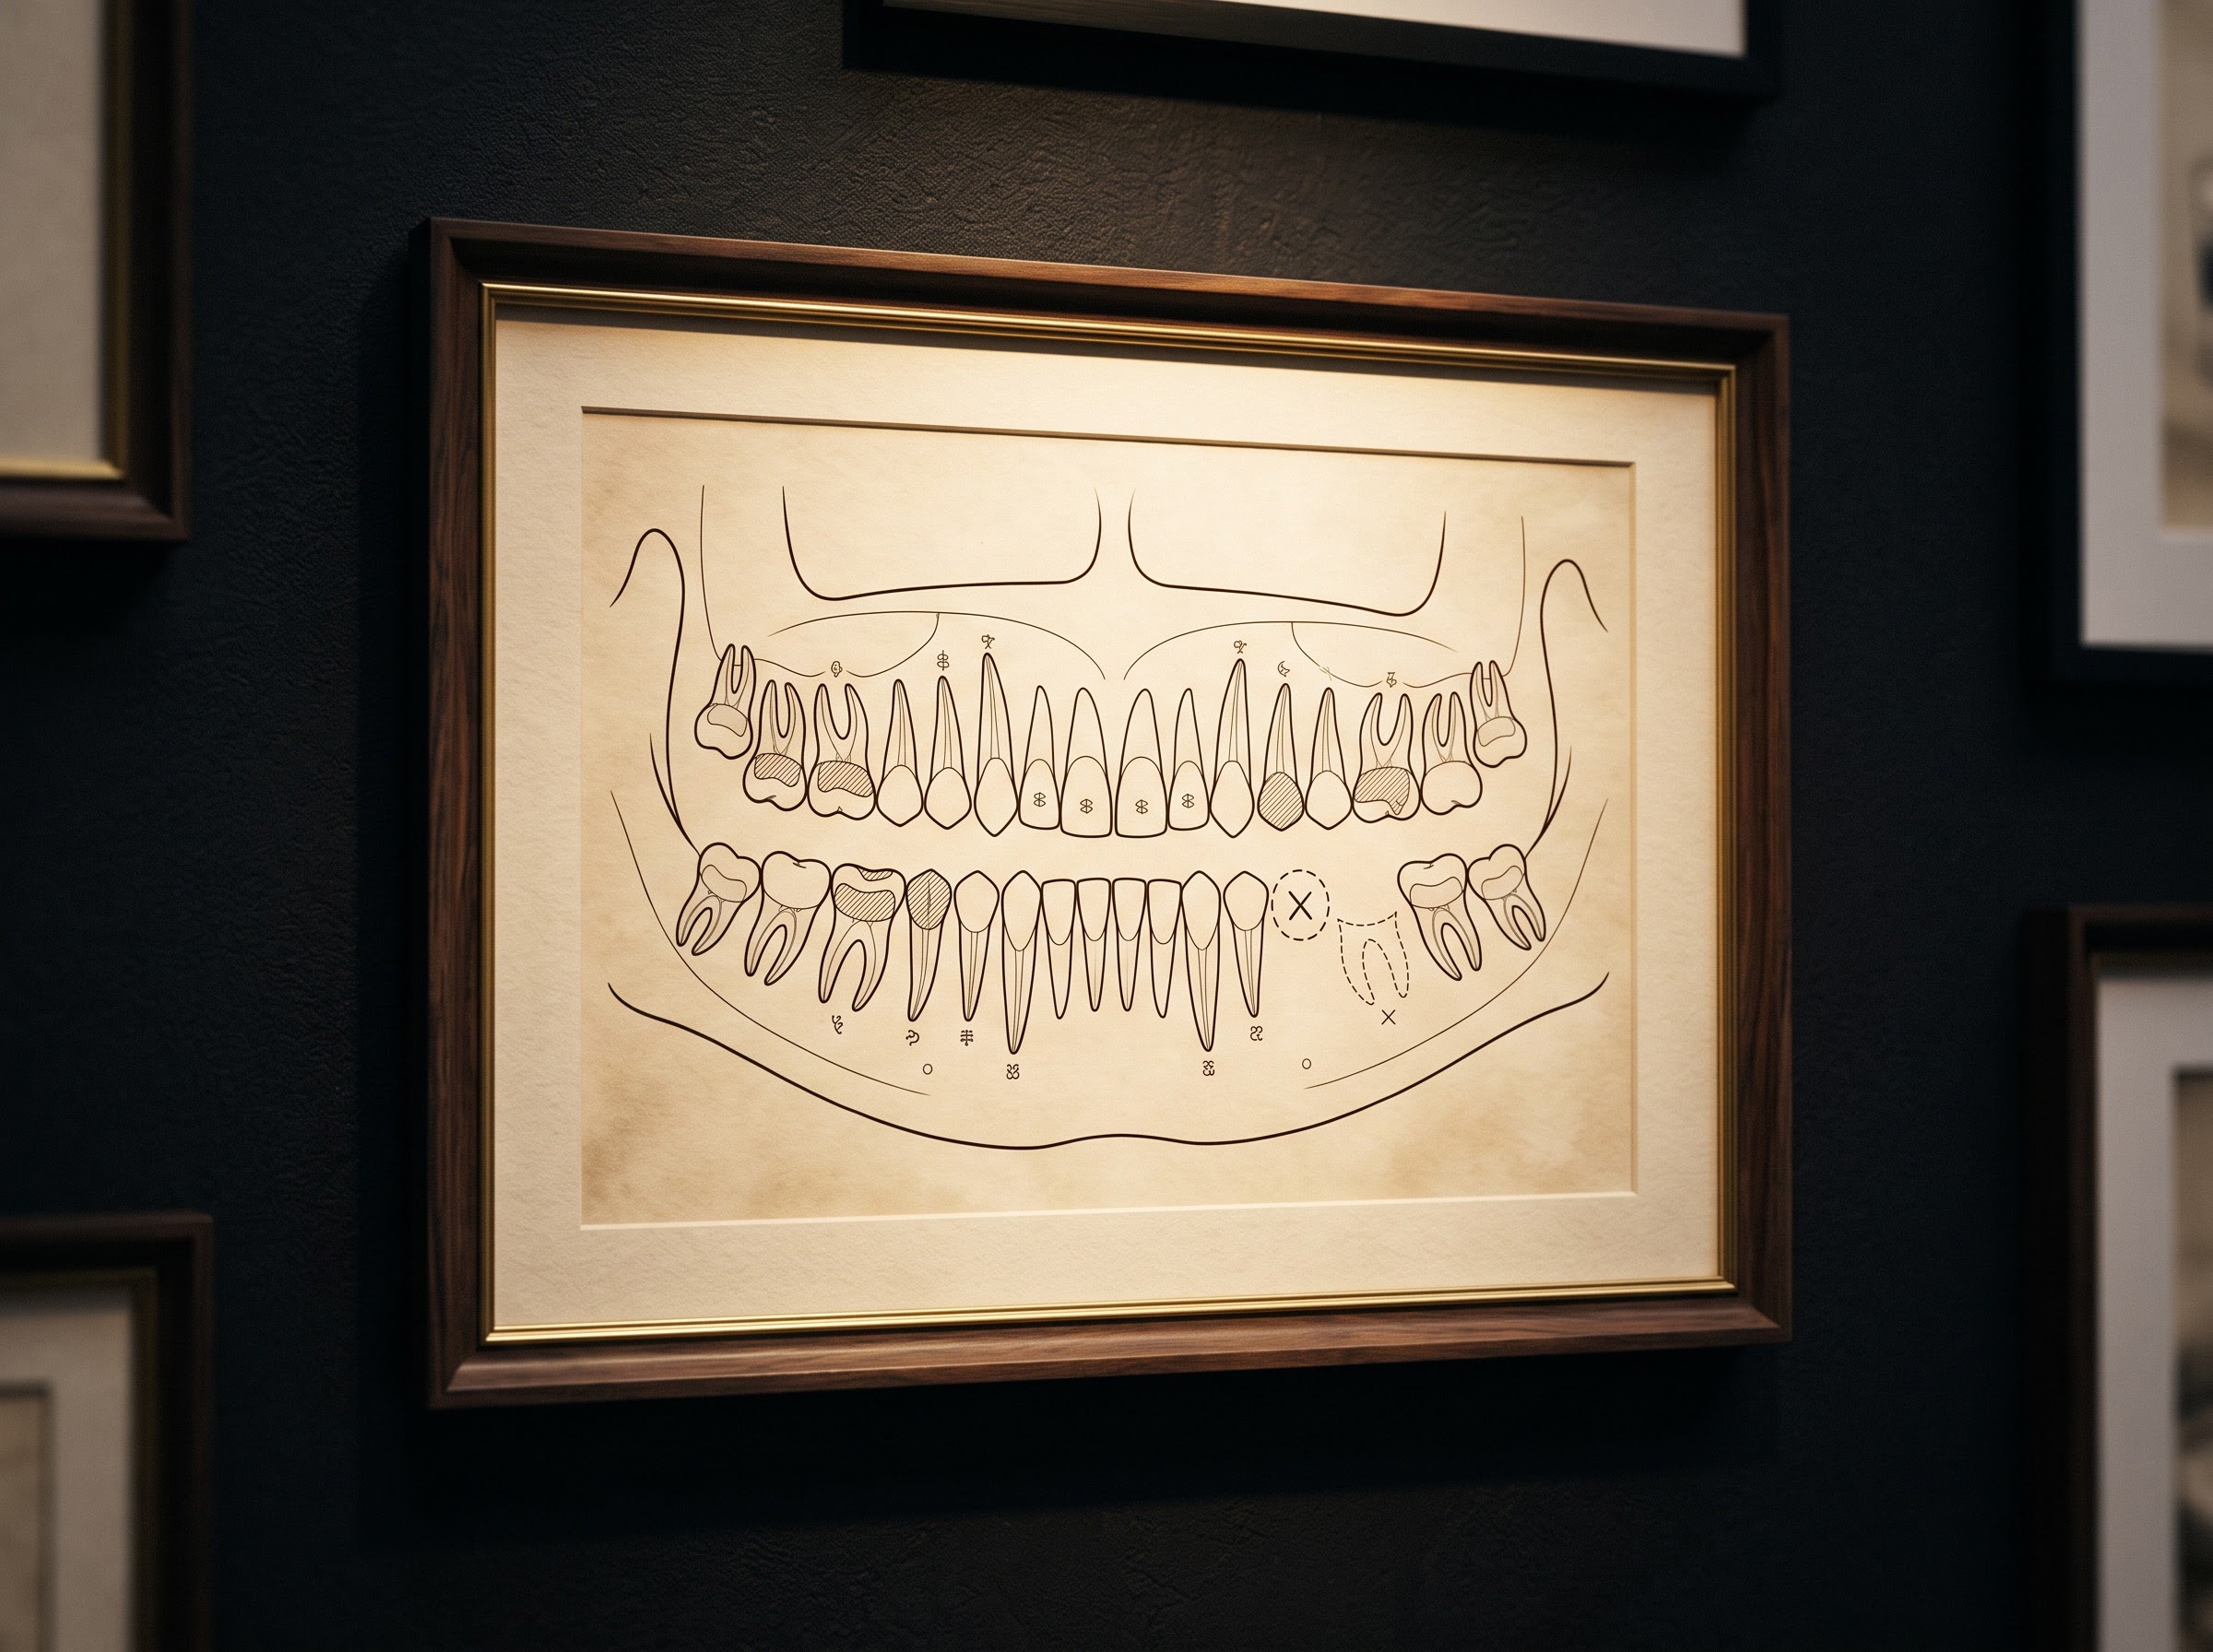
A complete chart records more than the teeth themselves. It notes what is absent — a gap where a tooth should be — and, increasingly, what has already been done: the existing restorations, crowns and roots that must be distinguished from native anatomy. Telling a filling from the tooth it sits in, or a developmental feature from pathology, demands that the model carry a fluent sense of normal radiographic anatomy, the same fluency a clinician leans on when separating real disease from its look-alikes. We traced that particular craft in reading the anatomy that pretends to be disease on the dental x-ray, and an auto-charting model that lacks it will mislabel confidently.
The dividend: a machine-readable mouth
The reward for all this labeling is leverage. Once a radiograph is a structured record, a diagnostic finding becomes genuinely useful: a suspected lesion is no longer a region on a picture but an observation attached to tooth 46, something that can be charted, audited, tracked over time and handed to the next clinician without ambiguity. Numbering and segmentation are therefore not a rival to diagnostic AI but its substrate — the addressing scheme that lets a detection mean something in a patient’s record rather than float, unanchored, on an image.
The same structure pays dividends in the mundane work that fills a practice day. Auto-charting can pre-populate the odontogram, reconcile an image against the existing chart, and surface discrepancies — a tooth marked present in the record but plainly missing on the film. Yet this is also where honesty is required. There is a persistent distance between what an imaging model can do in a dataset and what it reliably delivers across the messy diversity of real radiographs, a gap we examined in what radiology surveys reveal about everyday imaging. Crowded, rotated, supernumerary and primary-dentition cases remain where automatic charting quietly hands the work back to the clinician.
Charting drafts; the clinician owns the record
None of this removes the person from the chart. Automatic numbering produces a draft — a fast, consistent first pass that strips out the tedium of annotation — but the clinician verifies the labels, corrects the edge cases, and remains the author of the final record. The value proposition is precise and modest: speed, consistency, and the conversion of an image into something machine-readable. It is not a claim to judgment. A model that mislabels a rotated premolar is not a failure of the concept; it is a reminder of where the boundary between drafting and owning sits, and why it must stay where it is.
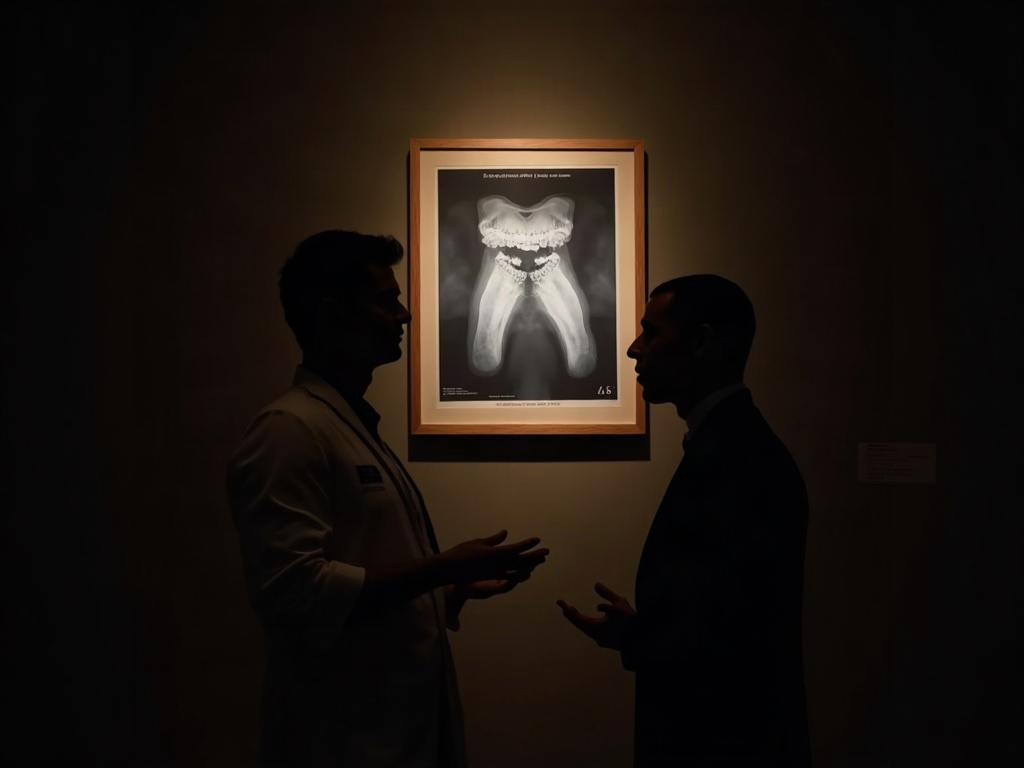
That boundary also sets the standard by which these tools should be measured. A good auto-charting system is not the one that is never wrong — it is the one whose errors are the obvious, correctable kind, surfaced plainly enough that a busy clinician catches them in a glance rather than inheriting them silently into the record. The best labeling, like the best framing in any gallery, is the kind that makes its own occasional mistakes easy to see.
Future Developments
The trajectory here is toward invisibility. As numbering and segmentation grow more reliable across the full range of real-world films, they will recede into the background of imaging software — an assumed first step, performed the instant an image is captured, rather than a feature anyone thinks about. What that quietly enables is larger than charting itself: structured, comparable records at scale, longitudinal tracking of each named tooth, and a foundation solid enough that higher-order diagnostic tools can stand on it without inheriting the ambiguity of an unlabeled image. The public, pixel-labeled datasets now being assembled are the raw material of that future, and their quality will set the ceiling for everything built above them. The glamour will always belong to the diagnosis. But the dentition had to be named and outlined before any of it was possible, and teaching the machine to perform that oldest act — carefully, correctably, and without pretending it is more than it is — is how imaging becomes not just something to look at, but something a record can finally read. Here, as ever, the craft is both science and art: the discipline of the outline is what lets the picture speak.
Sources & further reading:
- A multi-focus oral panoramic x-ray image dataset based on pixel-level annotations (Nature / Scientific Data)
- Deep learning for tooth detection, numbering and segmentation on dental radiographs (research overview)
Related Reading
- The Radiograph That Talks Back: When Vision-Language AI Learns to Describe a Dental Scan
- Diagnocat vs Pearl: Two AI Readers of the Dental Radiograph, and When Each One Earns Its Place
- The Collection Behind the Machine: Why a Public, Pixel-Labeled X-Ray Archive Is the Raw Material of Dental Imaging AI
No Comments