


October 9, 2026 The Numbers Beneath the Picture: Radiomics and the Quantitative Dental Image
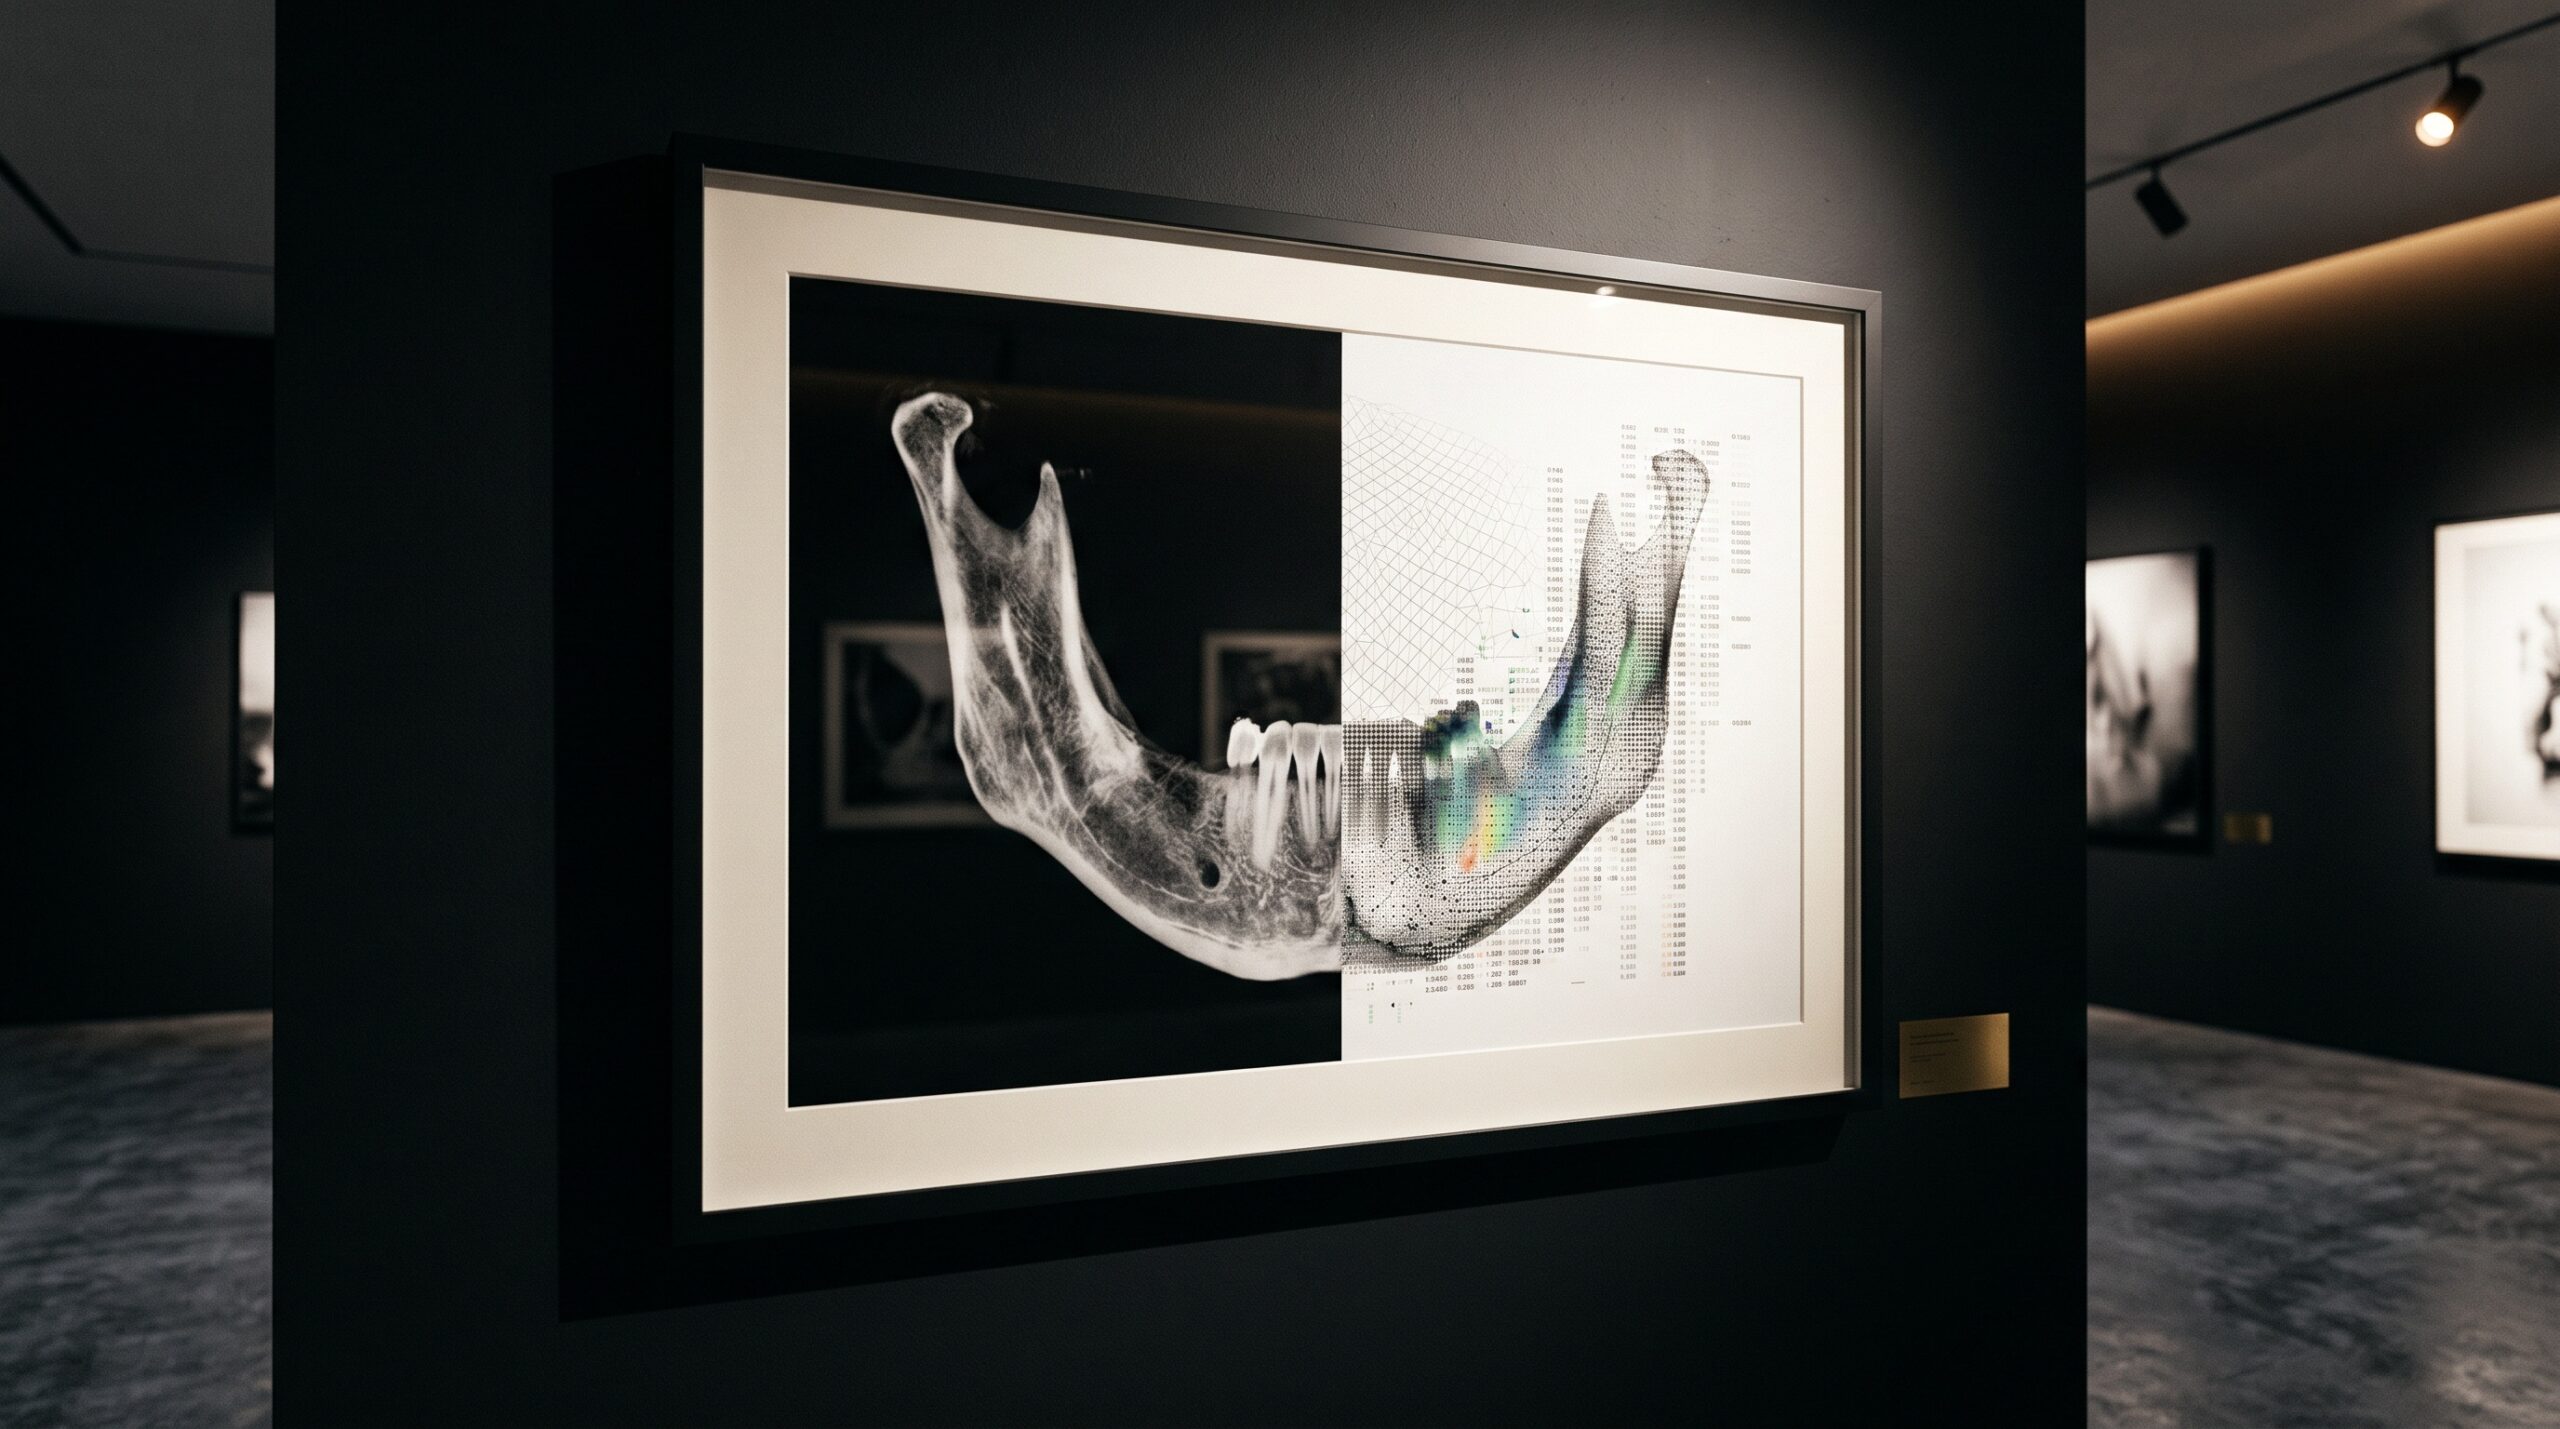
Stand close to a dental radiograph and it presents itself as a picture: a jaw rendered in grays, a lesion as a darker shadow, trabecular bone as a texture the eye reads at a glance and names, imprecisely, as coarse or fine, dense or sparse. Step back and remember what the image actually is, and a different truth appears. Every pixel is a number. Every gray tone is a measurement. The radiograph is not only a portrait of anatomy but a vast field of quantitative data, most of which no human reader ever consciously touches. Radiomics is the discipline that touches it — mining that field for patterns too subtle, too numerous, or too statistical for the eye to hold, and turning the image into something that can be measured rather than merely admired.
The image as a field of numbers
The word radiomics borrows its suffix from genomics, and the ambition is parallel: just as a genome can be read as a dense sequence of information, a medical image can be read as a dense sequence of quantitative features. The premise is that the gray-scale distribution within a region of interest encodes signal that correlates with underlying biology — the architecture of bone, the heterogeneity of a lesion, the micro-pattern of a healing socket — and that much of this signal lies below the threshold of visual perception. Radiomics does not replace the radiologist’s eye. It extends it into a range the eye cannot see, converting the texture of an image into a set of numbers that can be compared, tracked over time, and fed to a model.
This is a natural destination for a field that has spent decades making the dental image more quantitative. The same instinct that insists CBCT gray values are not true Hounsfield units, or that measures change over time with digital subtraction radiography, finds its fullest expression here: the image treated not as an illustration but as data.
What a radiomic feature actually measures
Radiomic features fall into intuitive families. First-order features describe the distribution of gray values within a region without regard to their arrangement — the mean, the spread, the skewness, the entropy of the histogram. They answer simple questions: is this region brighter, more uniform, more chaotic than that one? Second-order or texture features are where the craft deepens. These capture the spatial relationships between pixels: how often a given gray tone sits beside another, how long runs of similar intensity extend, how the pattern repeats or breaks. The best known is the gray-level co-occurrence matrix, which tallies the frequency with which pairs of intensities appear at a fixed distance and direction, and from which measures of contrast, correlation, and homogeneity are derived.
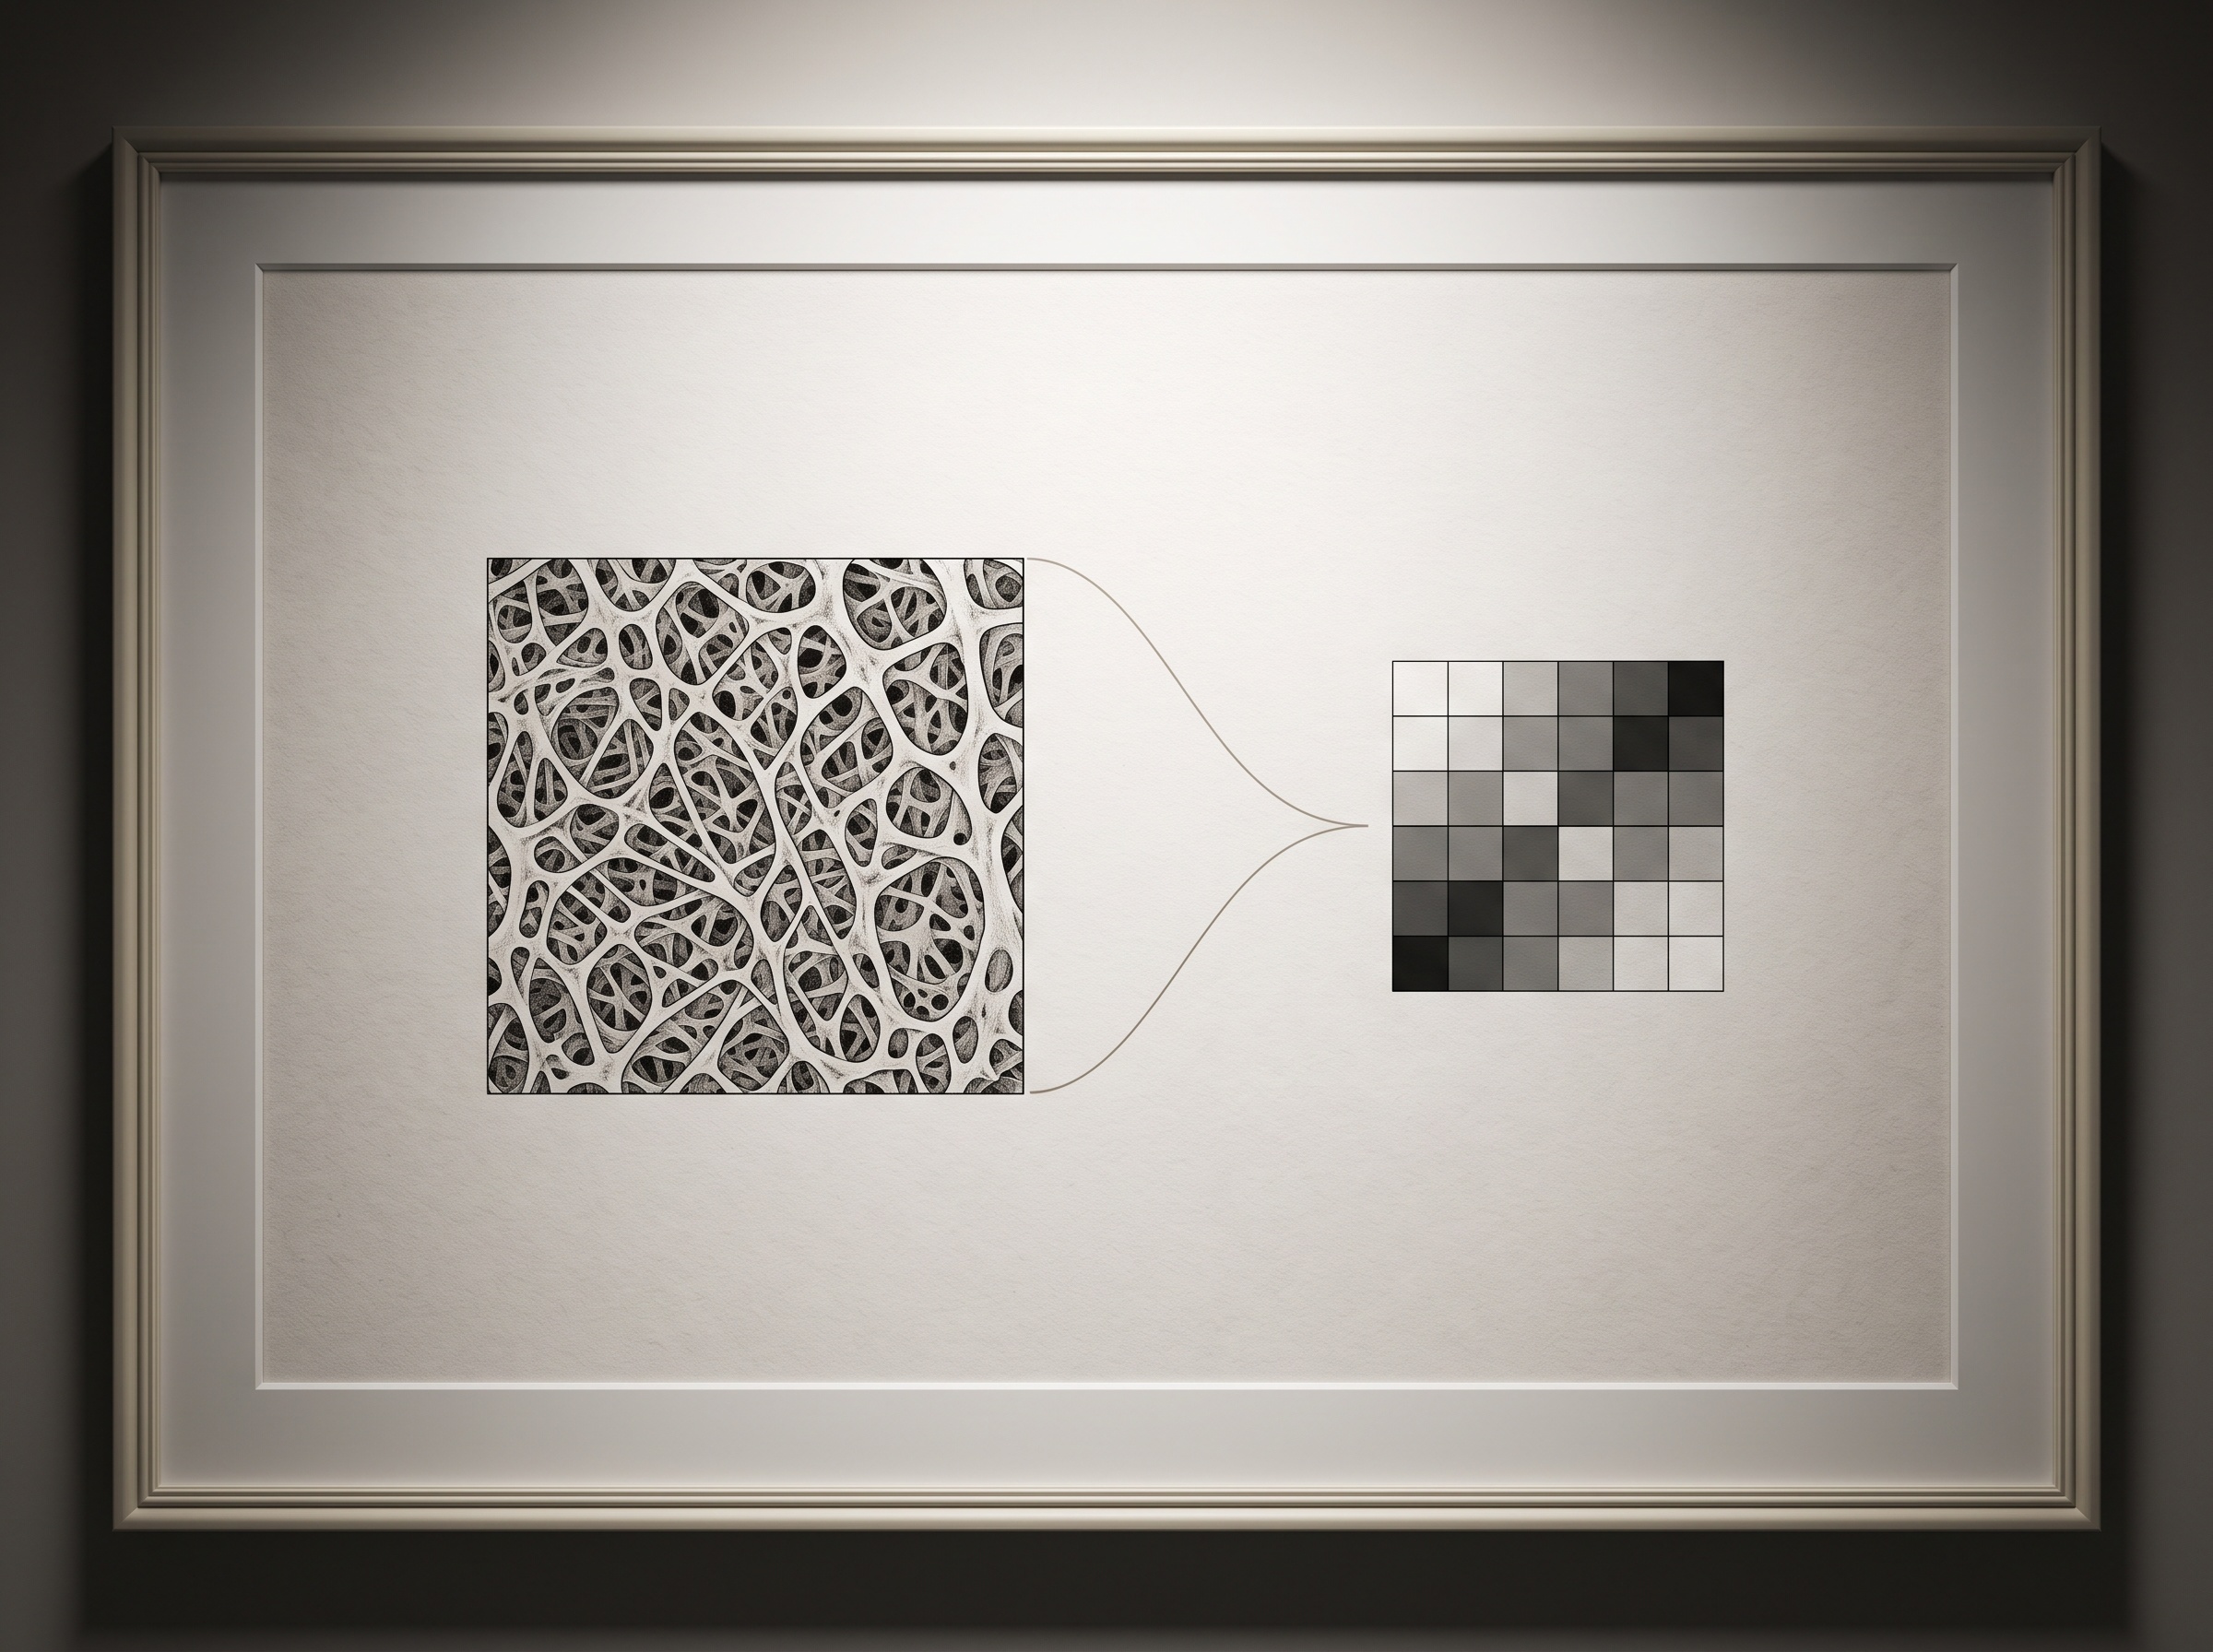
From a single outlined region a modern radiomics pipeline can extract hundreds of such features, and still more once the image is passed through mathematical filters that emphasize edges or particular spatial frequencies. A trabecular pattern that a clinician would describe in two or three adjectives becomes a vector of numbers — a quantitative fingerprint of the tissue’s texture. The promise is that somewhere in that fingerprint lies a signal the adjectives were too coarse to carry.
From eyeball to biomarker
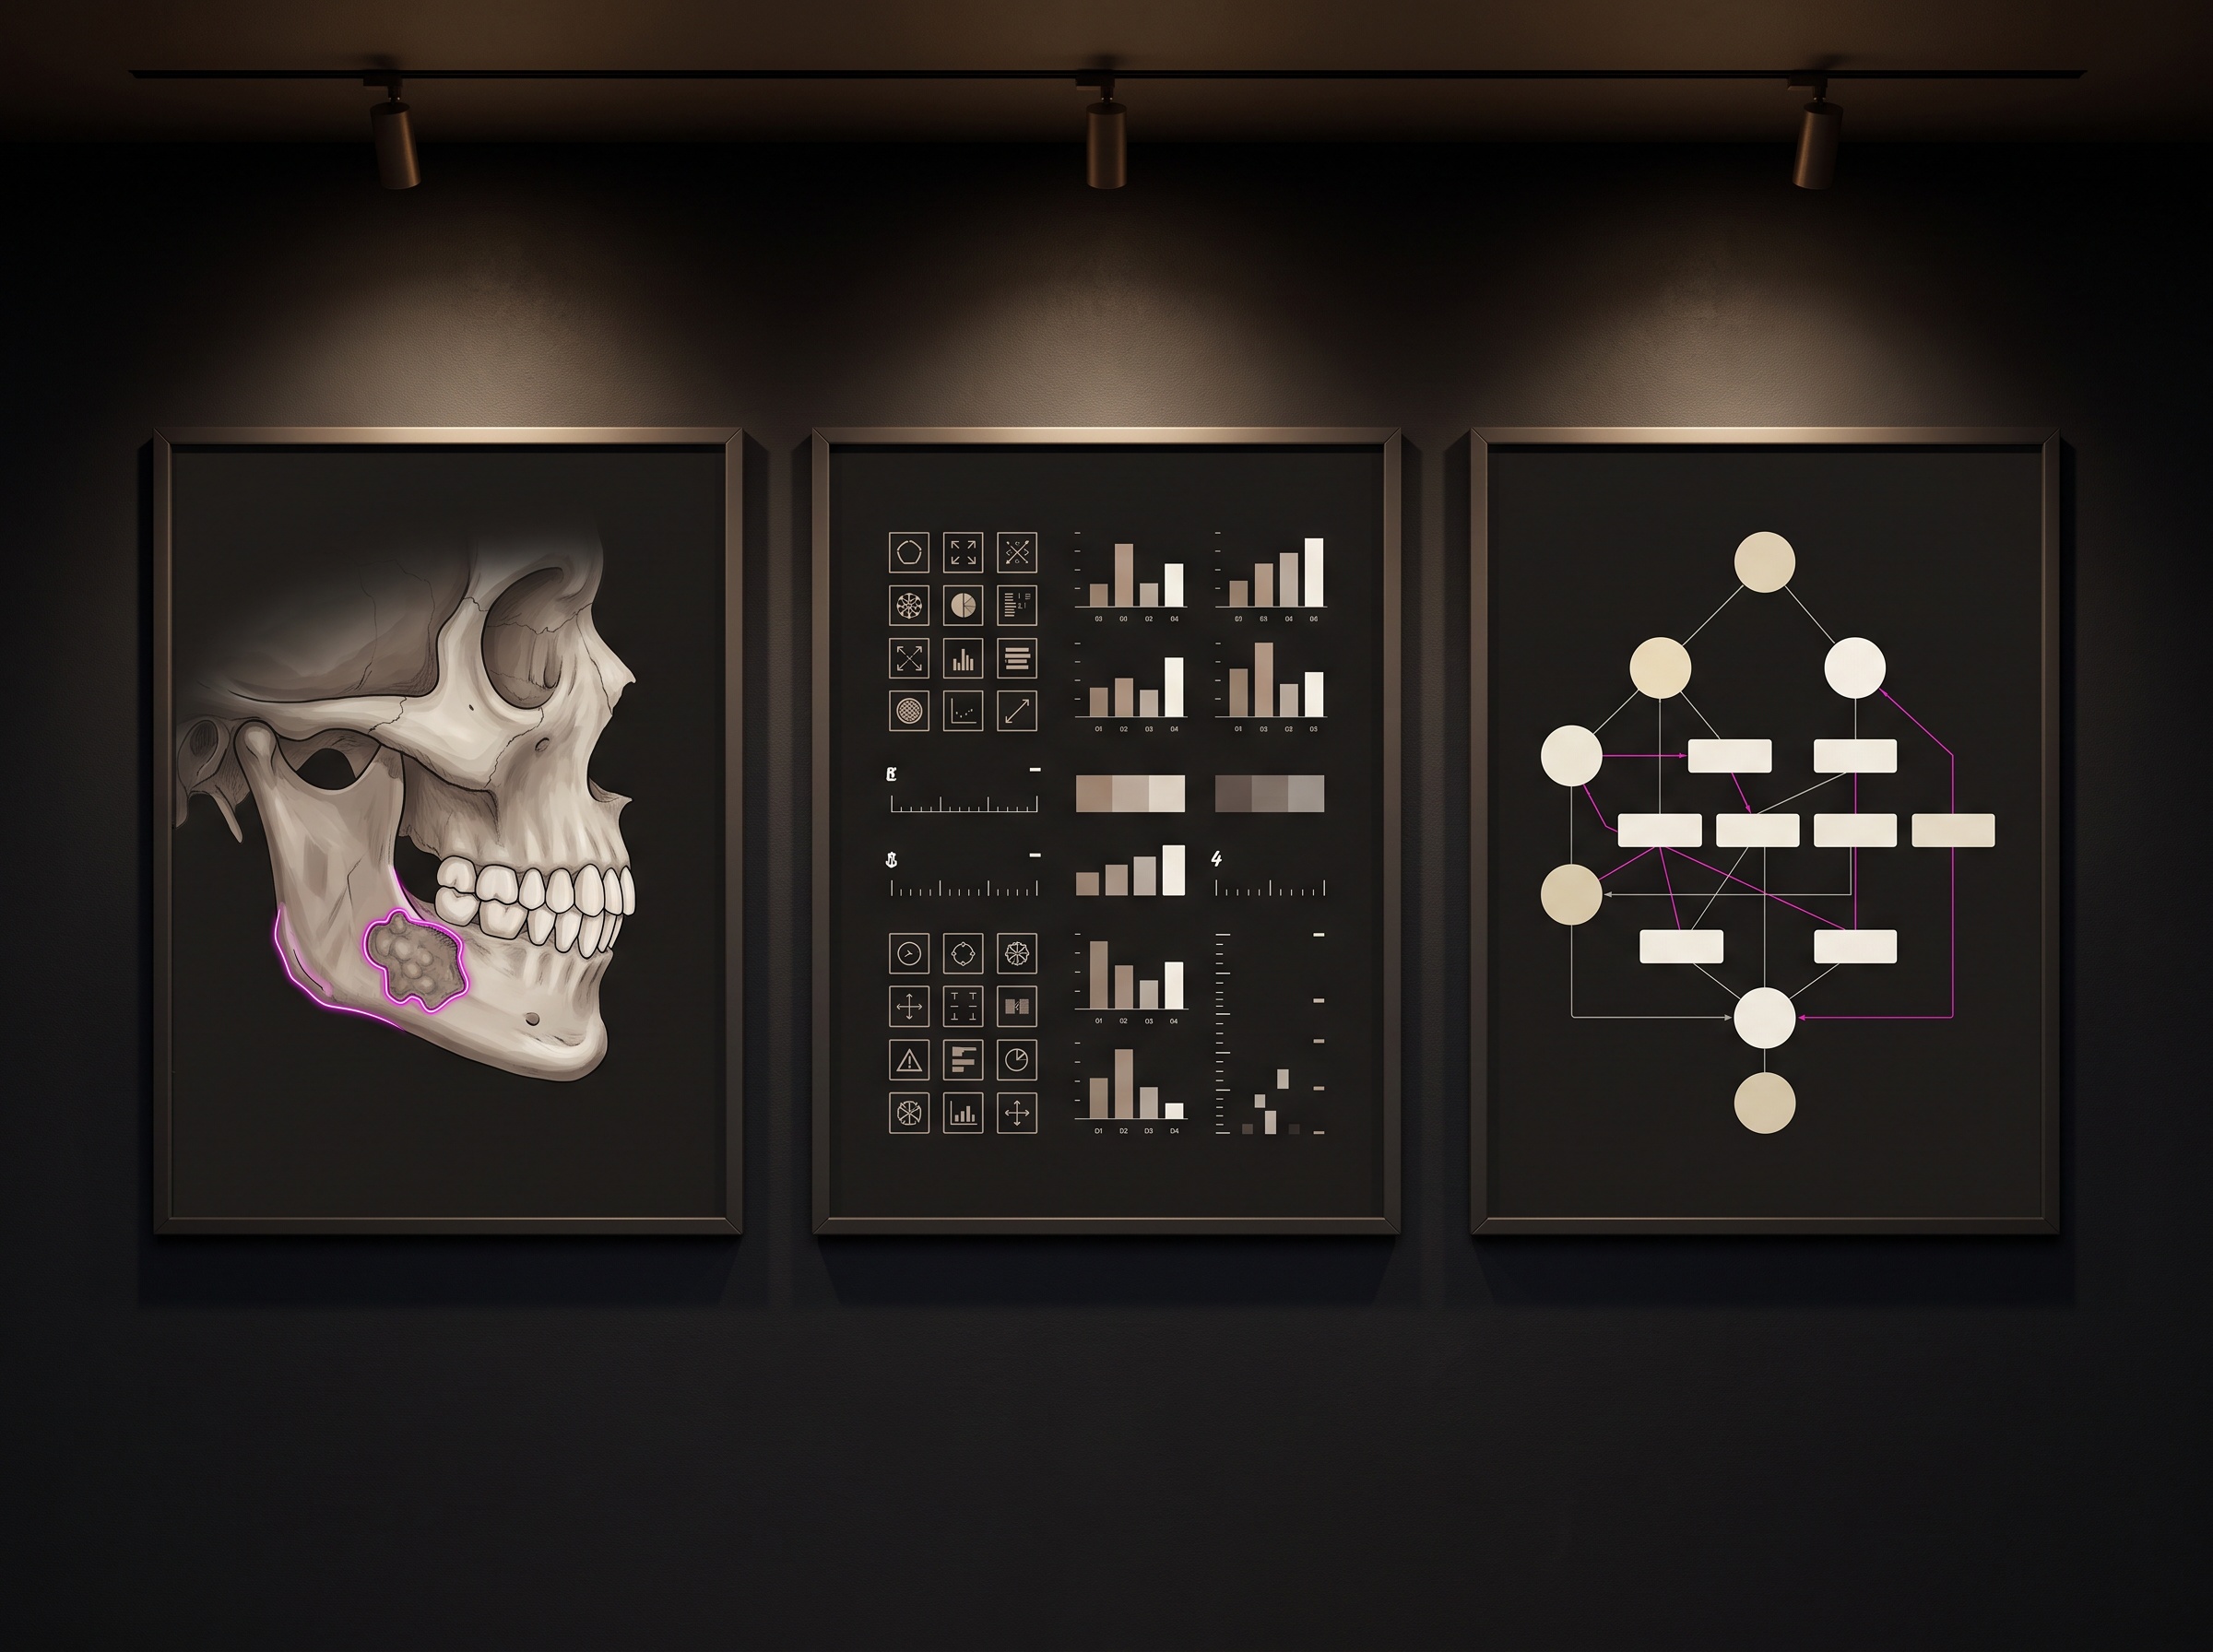
The pipeline that produces these numbers is disciplined, and every step is a place where craft matters. First the region of interest is segmented — a lesion, a condyle, a span of bone outlined slice by slice or by a trained model. Then the features are extracted under a fixed set of settings. Then the high-dimensional result is reduced, because hundreds of features from a modest number of patients is a statistical trap, and only the stable, non-redundant, informative ones are kept. Finally those survivors are handed to a model that learns to map the feature vector onto something clinically meaningful: this lesion is benign or aggressive, this site will heal or will not, this bone will accept an implant or resist it. The output is an imaging biomarker — a measurement derived from a picture that behaves like a lab value.
What the dental studies are finding
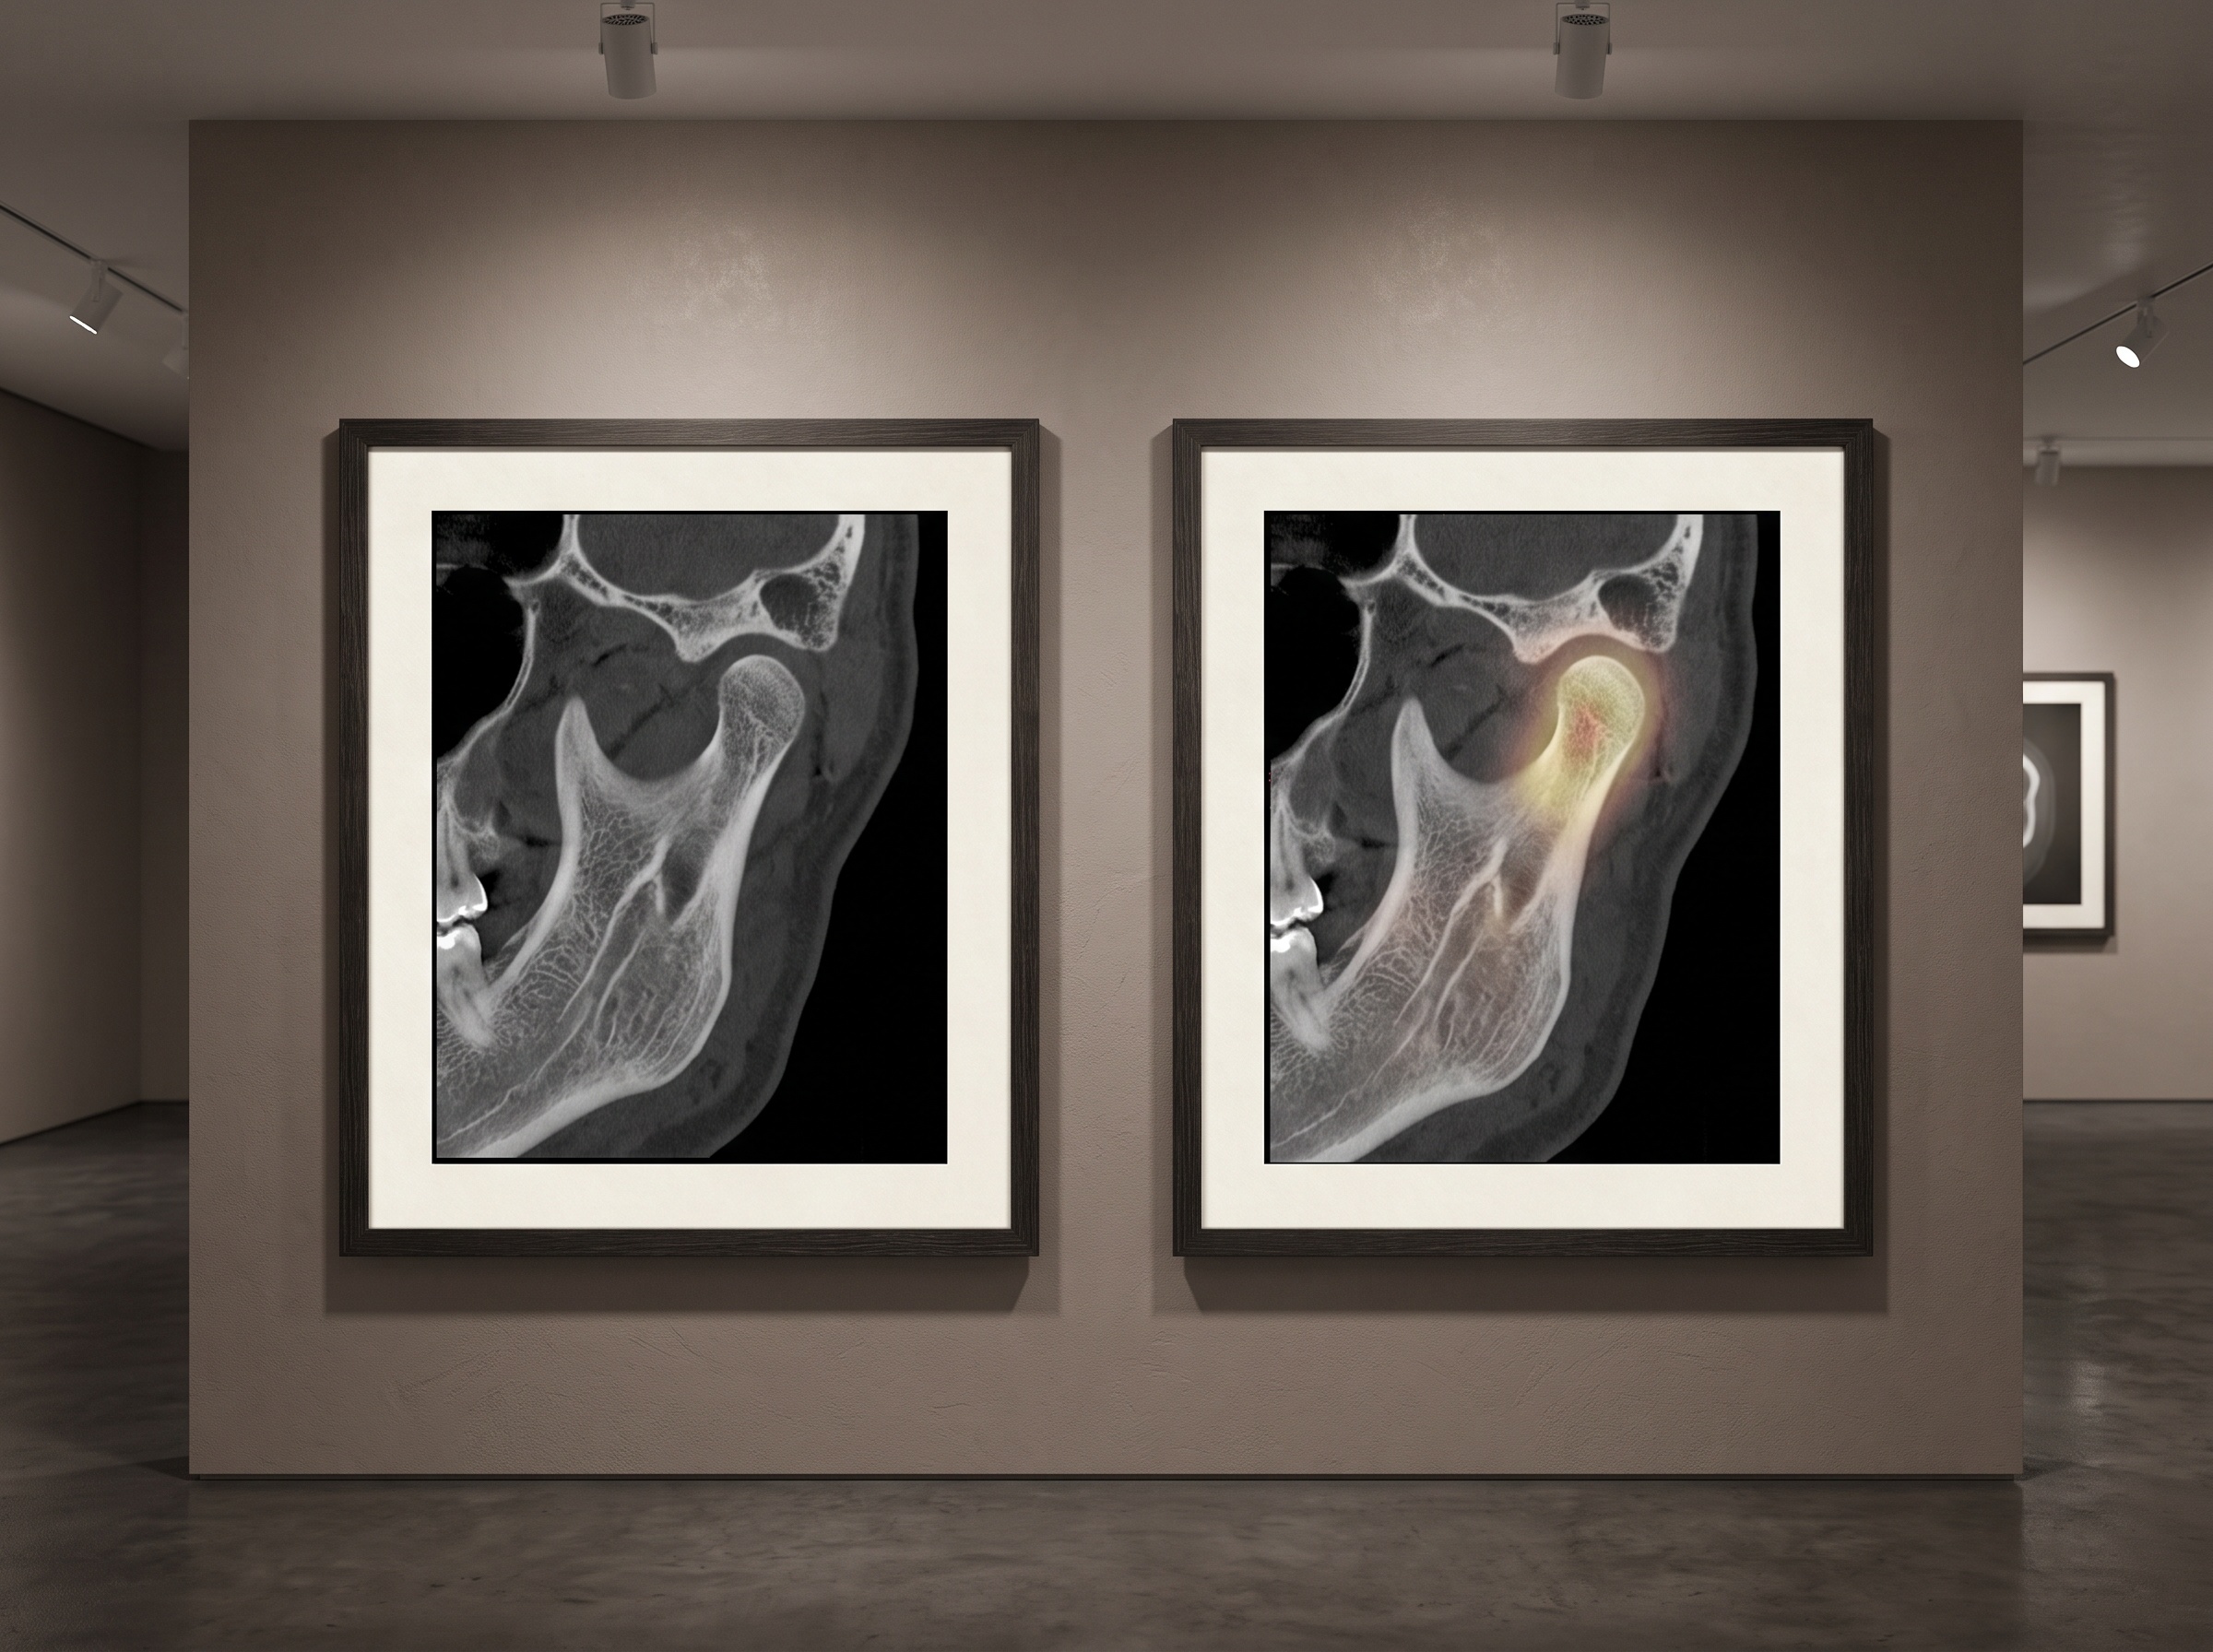
The dental literature of 2026 reads like a field testing its reach across the anatomy of the mouth. One study applied radiomic texture mapping to the mandibular condyle and reported that contrast-based texture maps improved the visualization of subtle simulated bone lesions in cone-beam CT — making defects easier to detect and raising the prospect of earlier temporomandibular joint diagnosis. The point is quietly profound: the texture map did not add any new data to the scan; it re-expressed the data already present so that a hidden pattern rose to the surface.
Elsewhere, researchers used CBCT-based radiomic analysis of architectural phenotypes to help distinguish among jaw cysts and tumors, pairing the features with interpretable artificial-intelligence models so the reasoning behind a classification could be inspected rather than taken on faith. In oral implantology, review work under the banner of oral implanomics argues that characterizing bone morphology, trabecular architecture, and image texture beyond visual assessment could support more objective evaluation of implant sites and better prediction of outcomes. And in endodontics, radiomic texture analysis of CBCT has been explored as a way to quantify periapical bone healing over time — a measurable readout of a process a clinician would otherwise judge by eye. Across these studies the thread is constant: a quantity extracted from texture, standing in for a judgment once left to impression.
The fragility of a feature
Here lies the true craft, and the true peril. A radiomic feature is only as trustworthy as it is reproducible, and texture features are exquisitely sensitive to how the image was made. Change the voxel size, the reconstruction algorithm, the field of view, or the exposure settings, and the numbers shift — sometimes more than the biological difference one hopes to detect. A gray-level statistic computed on a scan from one machine may not mean the same thing on another, because, as the field has long insisted, CBCT gray values are not standardized physical quantities to begin with. A feature that is robust in one study can evaporate in the next, and a model trained on one scanner’s texture can quietly fail on another’s.
This is why so much of serious radiomics is not glamorous mining but patient standardization: resampling images to a common voxel size, discretizing gray levels consistently, and adhering to shared definitions of how each feature is computed so that a number means the same thing in every lab. It is also why the oldest discipline still governs the newest: a good radiograph still underpins any analysis an algorithm performs. Feed the pipeline a noisy, poorly standardized image and it will dutifully extract hundreds of precise, meaningless numbers.
Radiomics, deep learning, and the hand-crafted feature
The features described so far are hand-crafted — defined in advance by human designers who decided, mathematically, what contrast and entropy and run-length should mean. Deep learning offers a rival path, in which a neural network learns its own features directly from the pixels, discovering patterns no one thought to specify. The two approaches are increasingly married: hand-crafted radiomic features prized for their transparency and interpretability, deep features prized for their raw discriminative power, and the same careful reconstruction that makes low-dose deep-learning reconstruction possible also shaping the texture that both methods must read. The attraction of the hand-crafted feature endures for a reason that matters in medicine: you can name it, you can audit it, and you can explain to a colleague why the image was called what it was called.
Future Developments
Radiomics asks us to see the dental image twice over — as the luminous picture it has always been, and as the quiet ledger of numbers it has always also been. The near future belongs to standardization: without it, a feature is a local curiosity rather than a portable biomarker, and the field’s own leaders know that reproducibility, not novelty, is the gate to the clinic. Expect texture maps to appear as an interpretive overlay beside the raw scan, surfacing subtle lesions the way a restorer’s raking light reveals a craquelure invisible head-on. Expect hand-crafted and learned features to converge into signatures that are both powerful and explainable. And expect the measurement to migrate from the research bench toward the operatory monitor, where one day a clinician may read not only the shape of a shadow but the number beneath it. The dental image has spent a century teaching us to look. Radiomics is teaching it, at last, to count — and the art will lie in knowing which of its numbers deserve to be believed.
Sources & further reading:
- Radiomic texture mapping improves visualization of simulated condylar bone lesions in cone beam computed tomography (PubMed, 2026)
- CBCT-based radiomic analysis of architectural phenotypes in jaw cysts and tumors using interpretable artificial intelligence models (World Journal of Radiology, 2026)
- Oral implanomics: radiomics and artificial intelligence in oral implantology (PubMed, 2026)
No Comments