


October 30, 2026 Bone Loss in Two Languages: Reading Periodontal Disease by Fusing the X-Ray With the Patient’s Chart
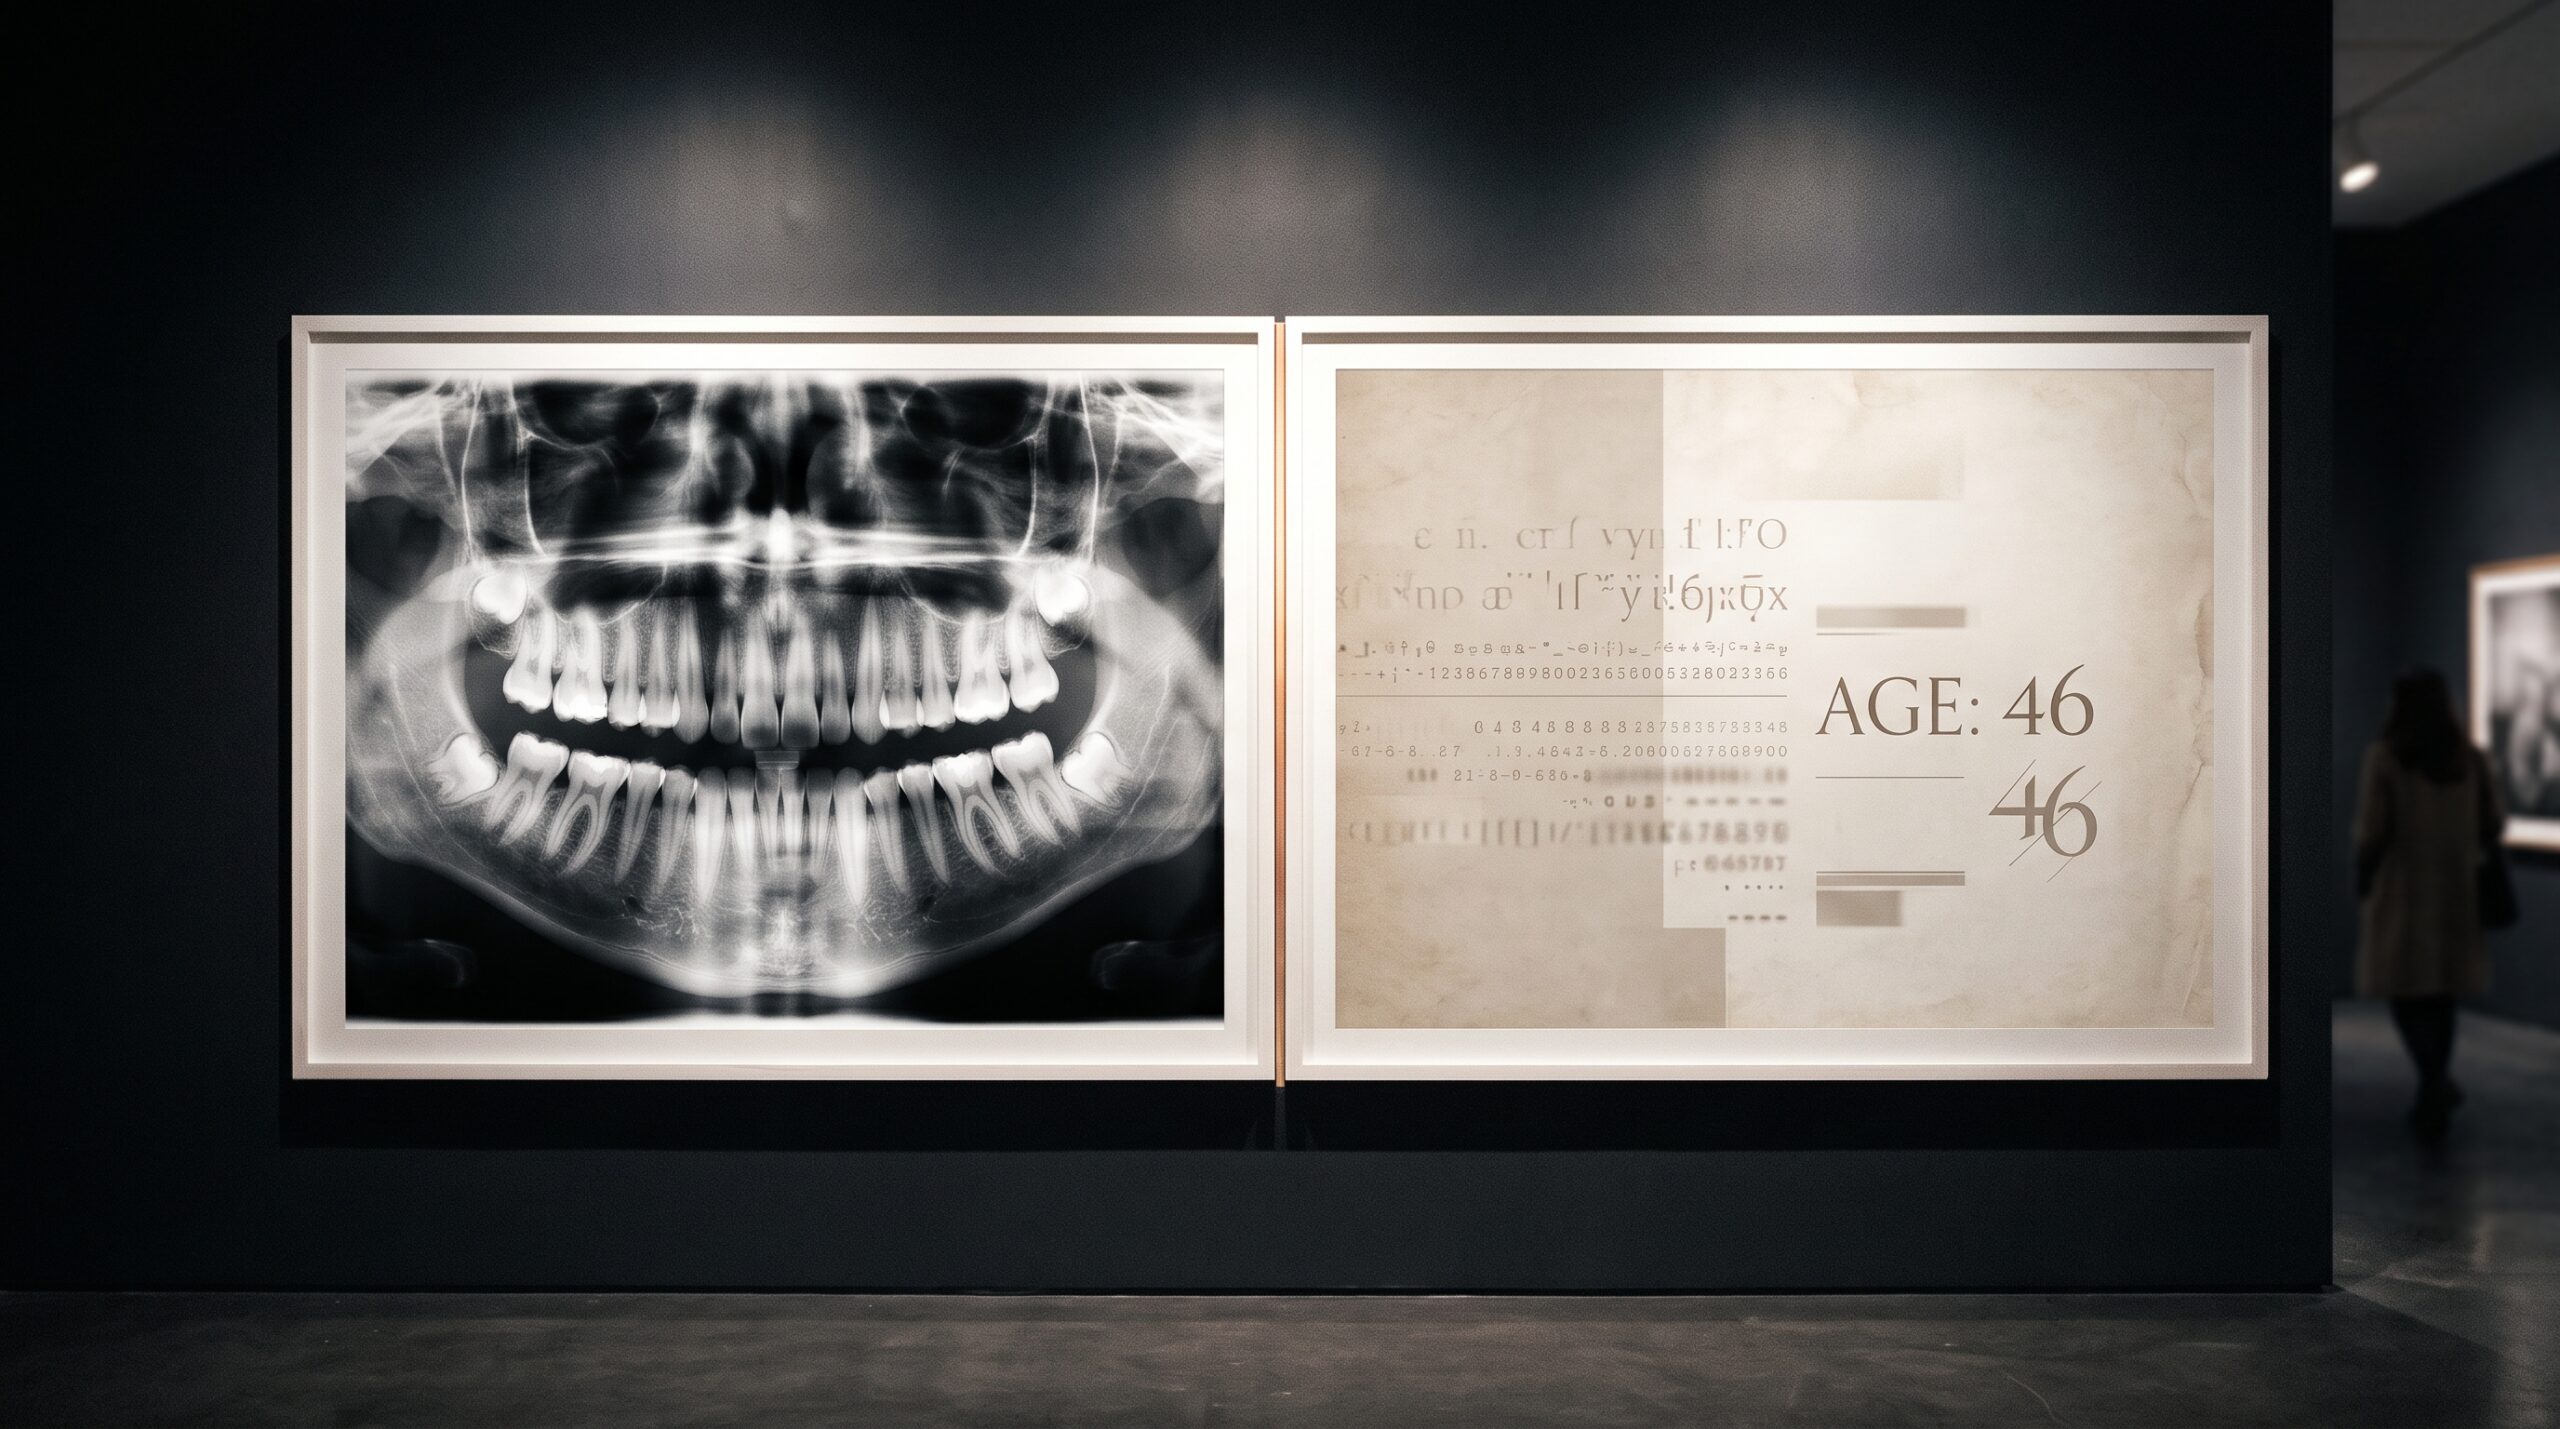
Periodontal disease is among the most common chronic conditions on earth, and one of its most eloquent signs hides in plain sight on an ordinary dental radiograph: the slow, silent recession of the bone that anchors a tooth in the jaw. The erosion is there in every panoramic film, written in degrees of gray. Reading it, however, is as much an act of judgment as of measurement. A clinician must decide how far the crest of bone has fallen relative to the length of the root, and that verdict wavers from one reader to the next, and sometimes from the same reader on two different mornings.
A study recently published open access in BMC Medical Imaging proposes that artificial intelligence can carry part of that burden, and that the secret to doing it well is counterintuitive. The gain comes not from staring harder at the picture, but from reading the chart sitting beside it.
The Judgment That Drifts
Bone loss on a two-dimensional radiograph is a notoriously unstable thing to grade. A panoramic image is a single flattened projection of a curved, three-dimensional jaw; overlapping structures, variable magnification, and the angle of the beam all conspire to blur the very boundary the clinician is trying to trace. Two experienced dentists, handed the same film, routinely disagree about whether resorption is mild, moderate, or severe. This is the quiet instability beneath a great deal of periodontal diagnosis, and it is precisely the kind of repetitive, perception-bound task where a consistent algorithmic second reader is appealing. The same tension between what a flat image shows and what the anatomy actually is runs through the choice of modality itself, a theme explored in our look at when a full-mouth series gives way to cone-beam CT.
Two Streams, One Verdict
Researchers Adnan Salman and Ibtehal Raghib Bishtawi of An-Najah National University built a framework that deliberately refuses to treat the radiograph as the whole story. Their model has two pathways. The first reads the image: a DenseNet-121 convolutional network, a design in which every layer receives the feature maps of all the layers before it, encouraging feature reuse and keeping the network lean enough to train on a modest medical dataset. The second pathway reads the metadata, the structured facts recorded alongside the scan, such as the patient’s age, handled by a classical multilayer perceptron that compresses those tabular inputs into a compact numeric signature.

The two streams are then joined by feature-level concatenation: the learned image features and the learned chart features are laid end to end into a single vector before the final layers deliver their classification. Training proceeded by progressive fine-tuning, unfreezing and retraining the network in stages so that pretrained visual knowledge could be adapted to the dental domain without being erased. It is an architecture of pragmatic engineering rather than spectacle, and its restraint is the point.
The Measure Called BRAR
The target the network learned to grade is the Bone Resorption Age Ratio, or BRAR, a measure that relates the degree of bone loss to the patient’s age. The logic is clinical common sense made quantitative: a given amount of resorption means something very different in a patient of twenty-five than in one of seventy. By folding age into the definition of severity itself, BRAR gives the model a reason to care about the chart and not only the film. It also explains why a purely visual reading, however sharp, can mislead; the same shadow of lost bone carries a different diagnostic weight depending on the life it belongs to.
What the Numbers Said
The evidence base was 988 annotated panoramic radiographs from a publicly available, de-identified dataset. To avoid the classic trap of a single lucky train-test split, the authors evaluated image-only, metadata-only, and fused models across twenty repeated stratified random splits, yielding a distribution of results rather than one flattering number. The multimodal model reached an accuracy of 0.67, a macro F1-score of 0.65, and a macro area under the ROC curve of 0.81. On the severe class, the cases that matter most for triage, its recall was 0.60, meaning it flagged roughly six of every ten of the worst presentations.
Those figures look modest beside the near-perfect scores that dominate AI headlines, but grading severity from a single flattened projection of a three-dimensional jaw is a genuinely hard problem, and it is the comparisons that give the result its weight. The fused model significantly outperformed the image-only model on macro F1 and macro AUC-ROC, both with Holm-adjusted p-values below 0.001, and on severe-class recall as well. Statistical honesty was built in: differences were tested with the Wilcoxon signed-rank test and corrected for multiple comparisons, raising the bar before any claim of significance could stand.
The Danger of the Chart Alone
The most instructive result is the one that failed. The metadata-only model, handed demographics but no image, identified only about fourteen percent of severe cases. Left to reason from age alone, it was all but blind to the patients in greatest danger, a failure rate that would be indefensible in a clinic. Age sharpens the picture; it cannot replace it. The finding is a useful corrective to the fantasy that structured data might one day make the radiograph optional, and a reminder that these systems are assistants with hard limits rather than oracles. That same caution animates our account of why a generalist chatbot still cannot be trusted to read a radiograph. The lesson that cuts both ways is that neither the image nor the chart is sufficient alone; diagnosis lives in the fusion.
Future Developments
A model that grades six in ten severe cases is not ready to sign a chart, and the authors are candid about it. But the architecture points somewhere worth going. The richest clinical signals rarely arrive in a single channel, and periodontal assessment is already drifting toward measurement in several registers at once, from the radiograph to the probe to newer techniques such as high-frequency ultrasound reading of the gingival phenotype. The next generation of these systems will likely fuse not two streams but several, aligning the image, the chart, the periodontal measurements, and perhaps the three-dimensional scan into one coherent verdict, with calibrated uncertainty attached so the clinician knows when to trust the machine and when to look again. The ambition is not to remove the reader’s judgment but to steady it, to turn a measurement that drifts from one morning to the next into something closer to a fixed point. In that light, the quiet achievement of this study is less the accuracy it reached than the principle it proved: that to read bone loss well, the image must be read together with the life it belongs to.
Sources & further reading:
No Comments