


August 28, 2026 The Color of Grayscale: Pseudocolor, Colormaps, and the Quiet Editorial Hidden in a False-Colored Image
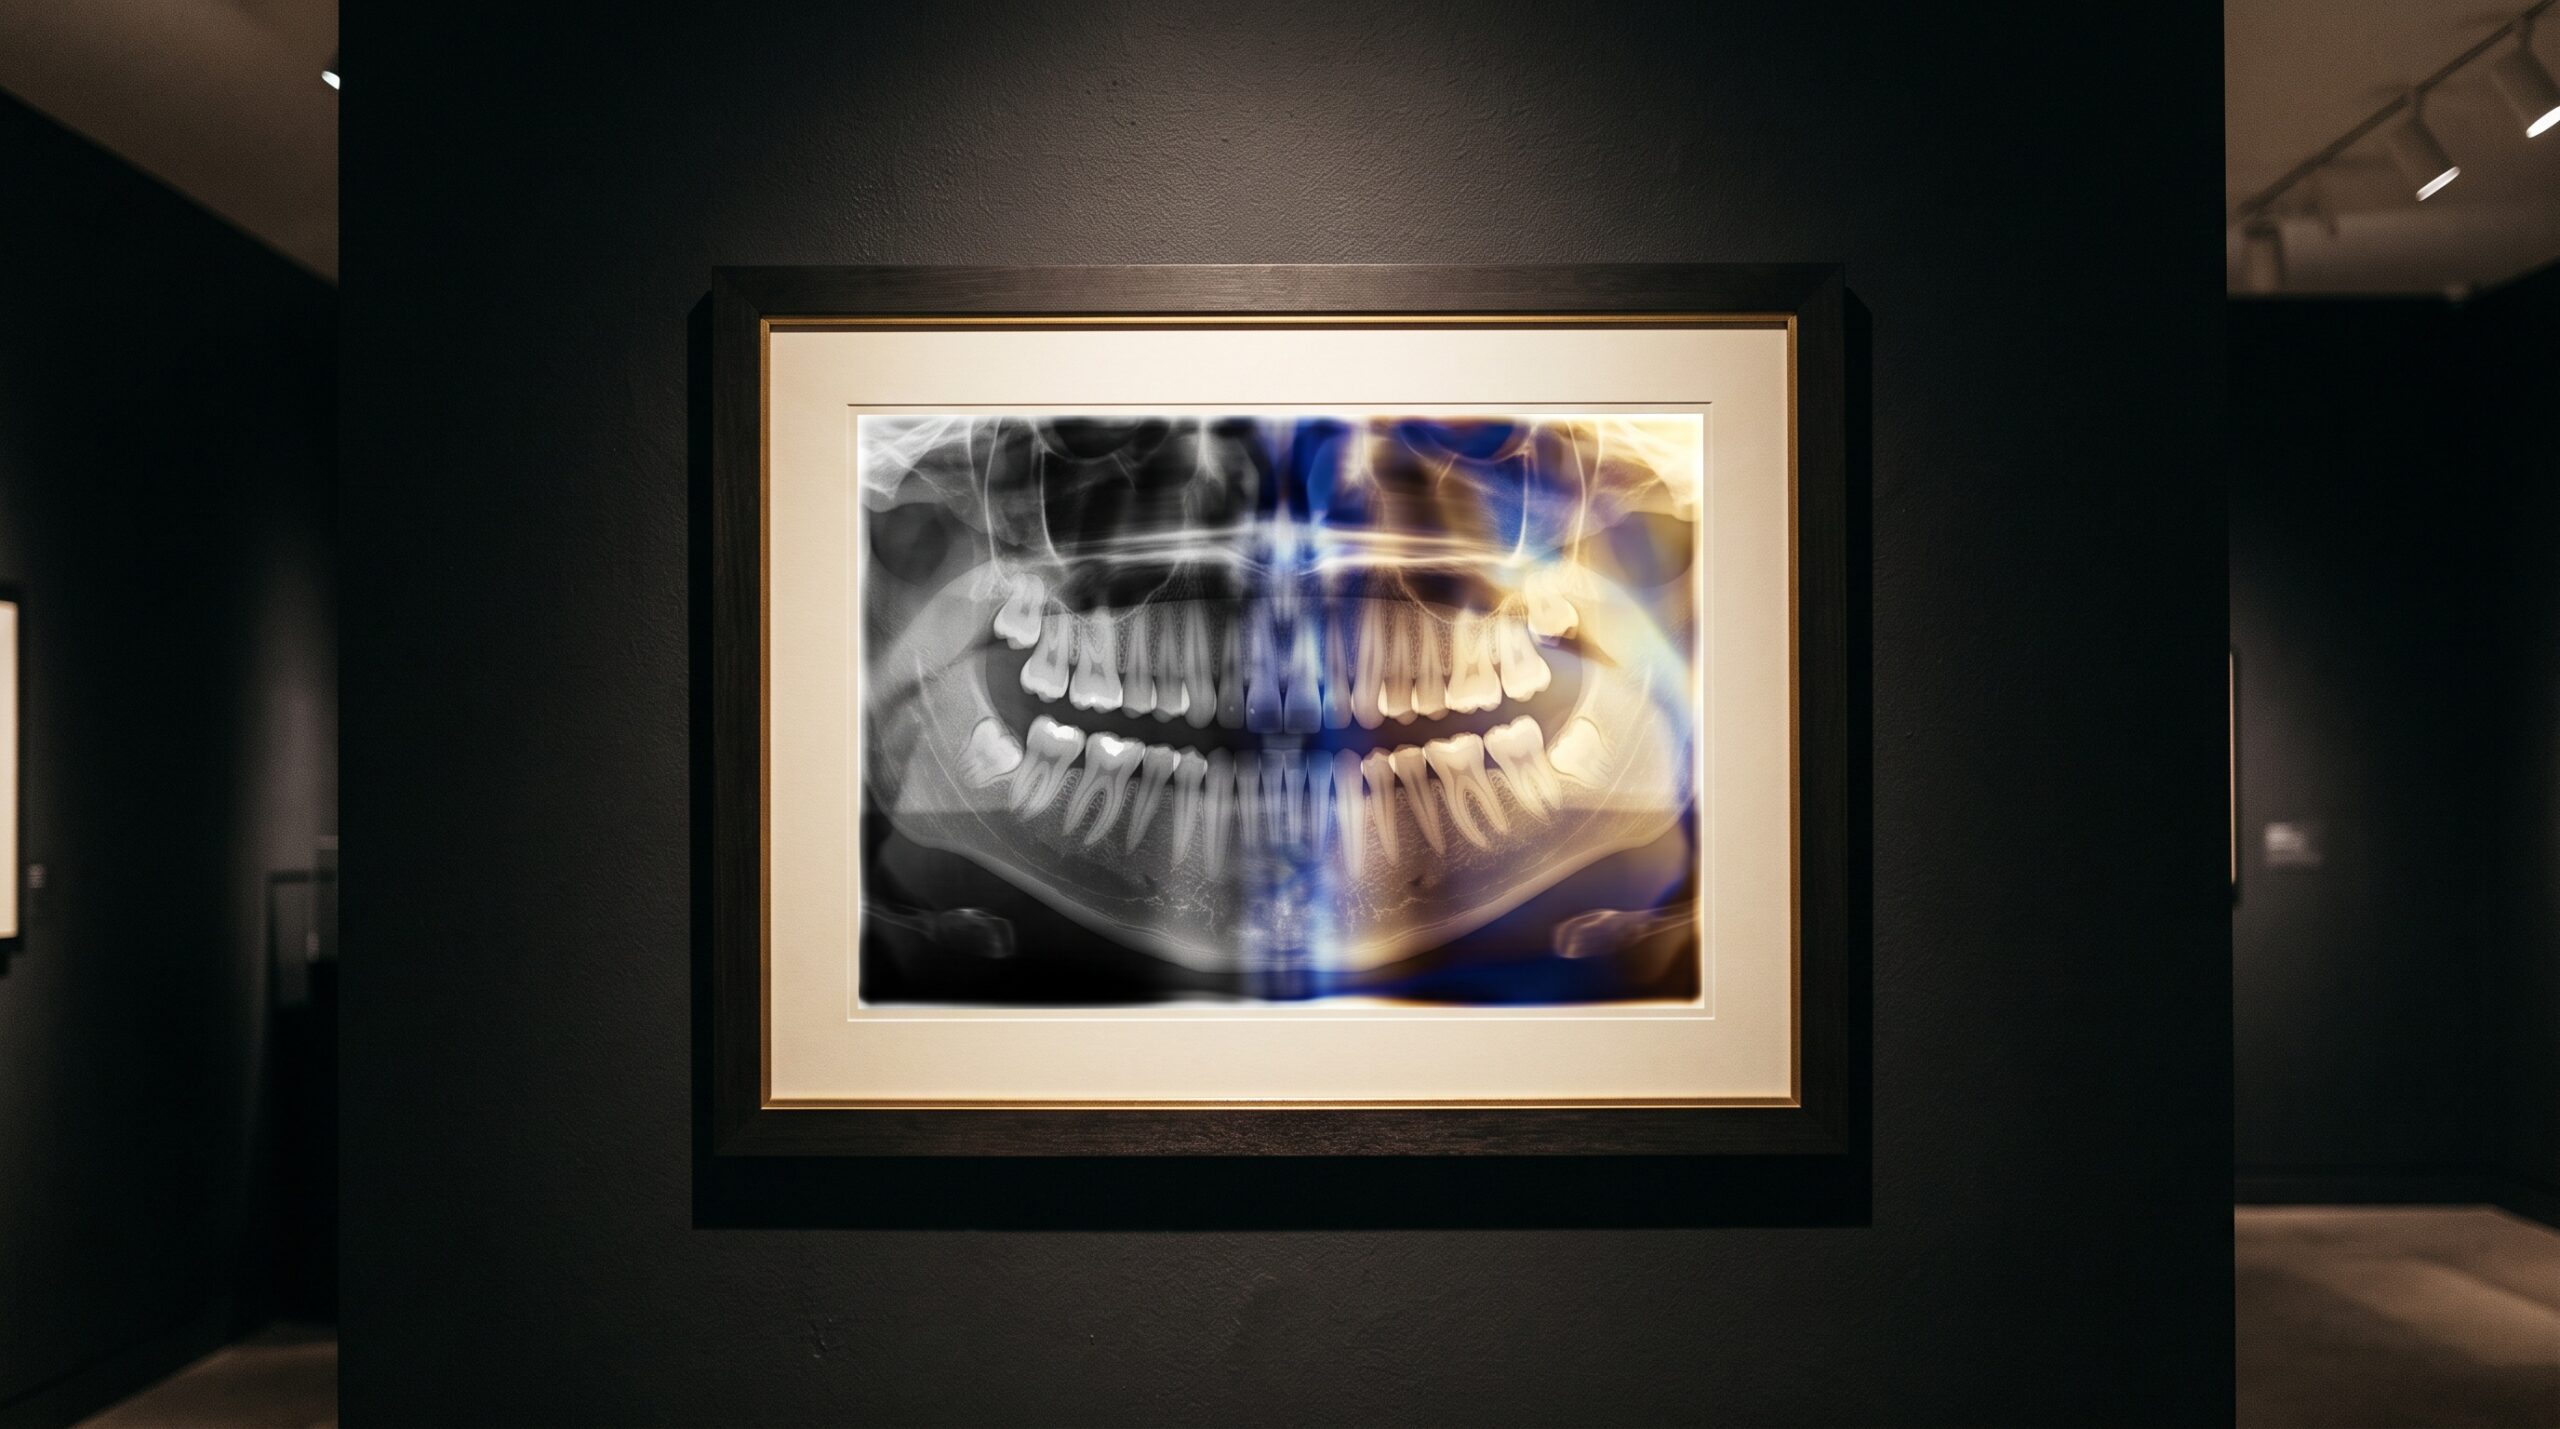
A dental radiograph arrives in the world as gray. Not because bone and enamel and pulp are gray, but because the sensor records a single number for each pixel – how many X-ray photons survived the journey through tissue – and gray is the honest, colorless way to show a number. A modern detector resolves that number into thousands, sometimes tens of thousands, of distinct levels. The human eye, presented with a smooth gray ramp, can reliably separate only a few dozen. Which means that in every radiograph there is a vast reservoir of recorded detail the gray simply cannot deliver to the viewer. Pseudocolor is the oldest trick for spending that reservoir – and one of the most quietly consequential decisions in all of imaging.
Why We Paint a Number
The premise is almost embarrassingly simple. If the eye is poor at telling near-identical grays apart but exquisitely good at telling colors apart, then assign each gray value a color instead. A subtle difference in density that would vanish inside an indistinguishable smear of charcoal becomes, in color, the difference between teal and amber – obvious, immediate, impossible to miss. This is not manipulation of the underlying measurement; the number in each pixel is untouched. It is a change of costume. The technical machinery behind it is a lookup table, or LUT: a small dictionary that says gray value 4,000 shall be rendered as this blue, value 12,000 as that gold. Swap the dictionary and the picture changes wardrobe without changing a single fact.
Used well, pseudocolor is revelatory. Bone-density gradients that hide inside the flat grays of a cone-beam slice separate into legible bands. The faint periapical change a reader might scroll past declares itself. It is the same instinct that drives every careful choice about how tone is presented, the concern at the heart of the grayscale craft behind a diagnostic radiograph – except that here we leave grayscale entirely, trading the calm of neutral tone for the loud vocabulary of hue.
The Rainbow That Lies
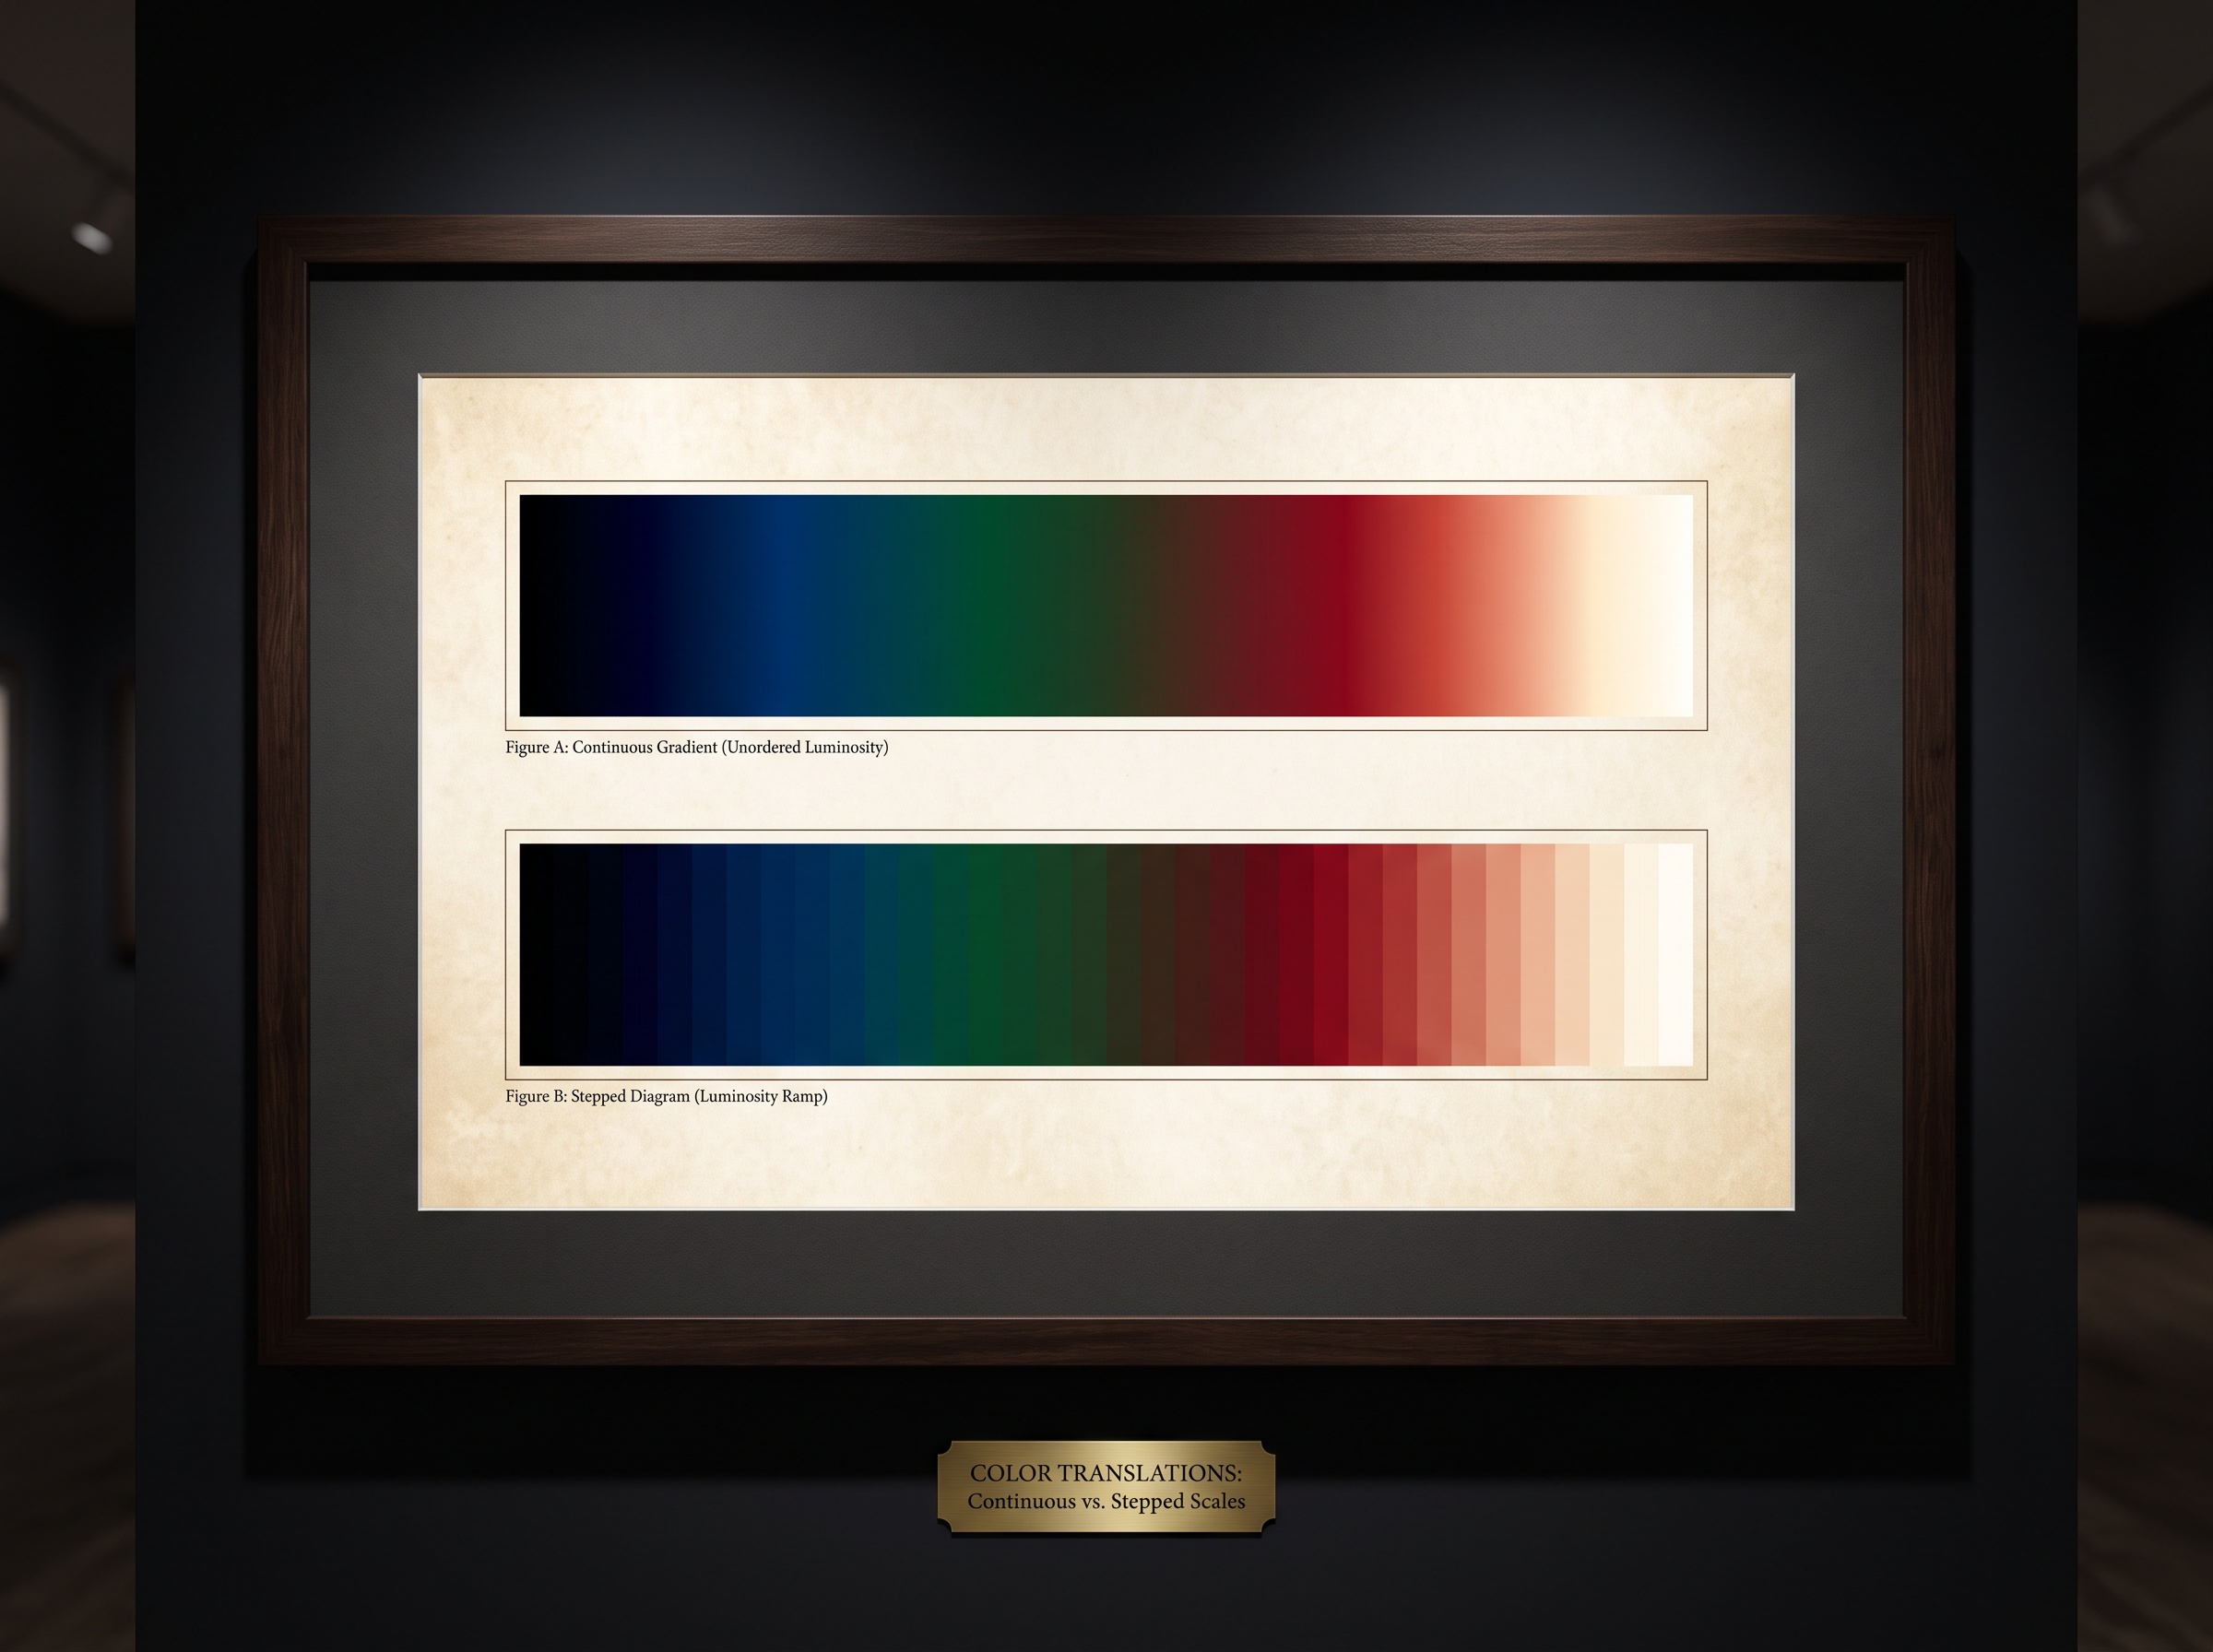
And loudness is exactly the danger. The most famous colormap in scientific history is the rainbow – the “jet” scale that sweeps blue to green to yellow to red – and it has been quietly deceiving viewers for decades. The problem is that the rainbow is perceptually non-uniform. Our eyes register the jump from cyan to green as gentle, but the jump from green to yellow as a sudden, brilliant leap. So a colormap that steps evenly through data does not step evenly through perception. Where the data is perfectly smooth, the rainbow invents a sharp edge – a false boundary that the reader’s eye interprets as a real structure. A gradient of bone becomes a hard yellow rim that no anatomy put there. The colormap has hallucinated a finding.
Worse, the rainbow scrambles order. Is red “more” than blue, or is yellow the peak? Nothing about the hues themselves tells you; you have to consult the legend and hold it in memory. Brightness, by contrast, carries order for free – lighter reads as more, always, without a decoder ring. This is why the imaging and visualization communities spent years arguing, in earnest, that the rainbow color map should be considered harmful, and why the perceptually uniform successors – the smooth, evenly brightening scales now built into serious software – were engineered so that equal steps in the data produce equal steps in apparent lightness. A false color that respects perception reveals; one that ignores it fabricates.
The Editorial Nobody Signs
Here is the uncomfortable part for anyone who treats the clinical image as a document of record. Choosing a colormap is an editorial act. It decides which differences in the data will be made visible and which will be flattened into invisibility, which region will draw the eye and which will recede. Two clinicians handed the identical dataset and two different LUTs can walk away with two different impressions – not because the measurement changed, but because the presentation curated their attention. Pseudocolor sits in the same family of persuasive processing as the sharpening and contrast adjustments explored in how post-processing can quietly deceive on a digital radiograph: each is a legitimate tool that can, with the best intentions, put emphasis where the biology did not.
The gallery understands this instinctively. A curator does not merely hang a canvas; she chooses the wall color, the frame, the angle of the light – and every one of those choices tells the eye what to prize. A colormap is the lighting rig of a data image. Applied with restraint and disclosure, it honors the work. Applied carelessly, or worse, applied to make a marginal finding look decisive, it becomes rhetoric wearing the costume of measurement.
Color as the Voice of the Algorithm
Nowhere is this more alive today than in the warm glow of the machine. When an AI system flags a suspected caries or a periapical lesion, it rarely hands back a plain verdict; it hands back a heatmap – a translucent pseudocolored wash laid over the radiograph, brightest where the model’s confidence is highest. That heatmap is pure colormap logic. The algorithm outputs a grid of probabilities, a fresh grayscale in all but name, and a LUT paints it into something a clinician can absorb at a glance. The persuasive power is enormous, and so is the responsibility: a vivid red bloom feels like certainty even when the number beneath it is a hesitant sixty percent. The same discipline that makes any grayscale honest applies doubly to these overlays, which is why the presentation of a model’s reasoning belongs in the same conversation as the structured reporting that makes a radiograph legible – the color must report the confidence faithfully, not flatter it.
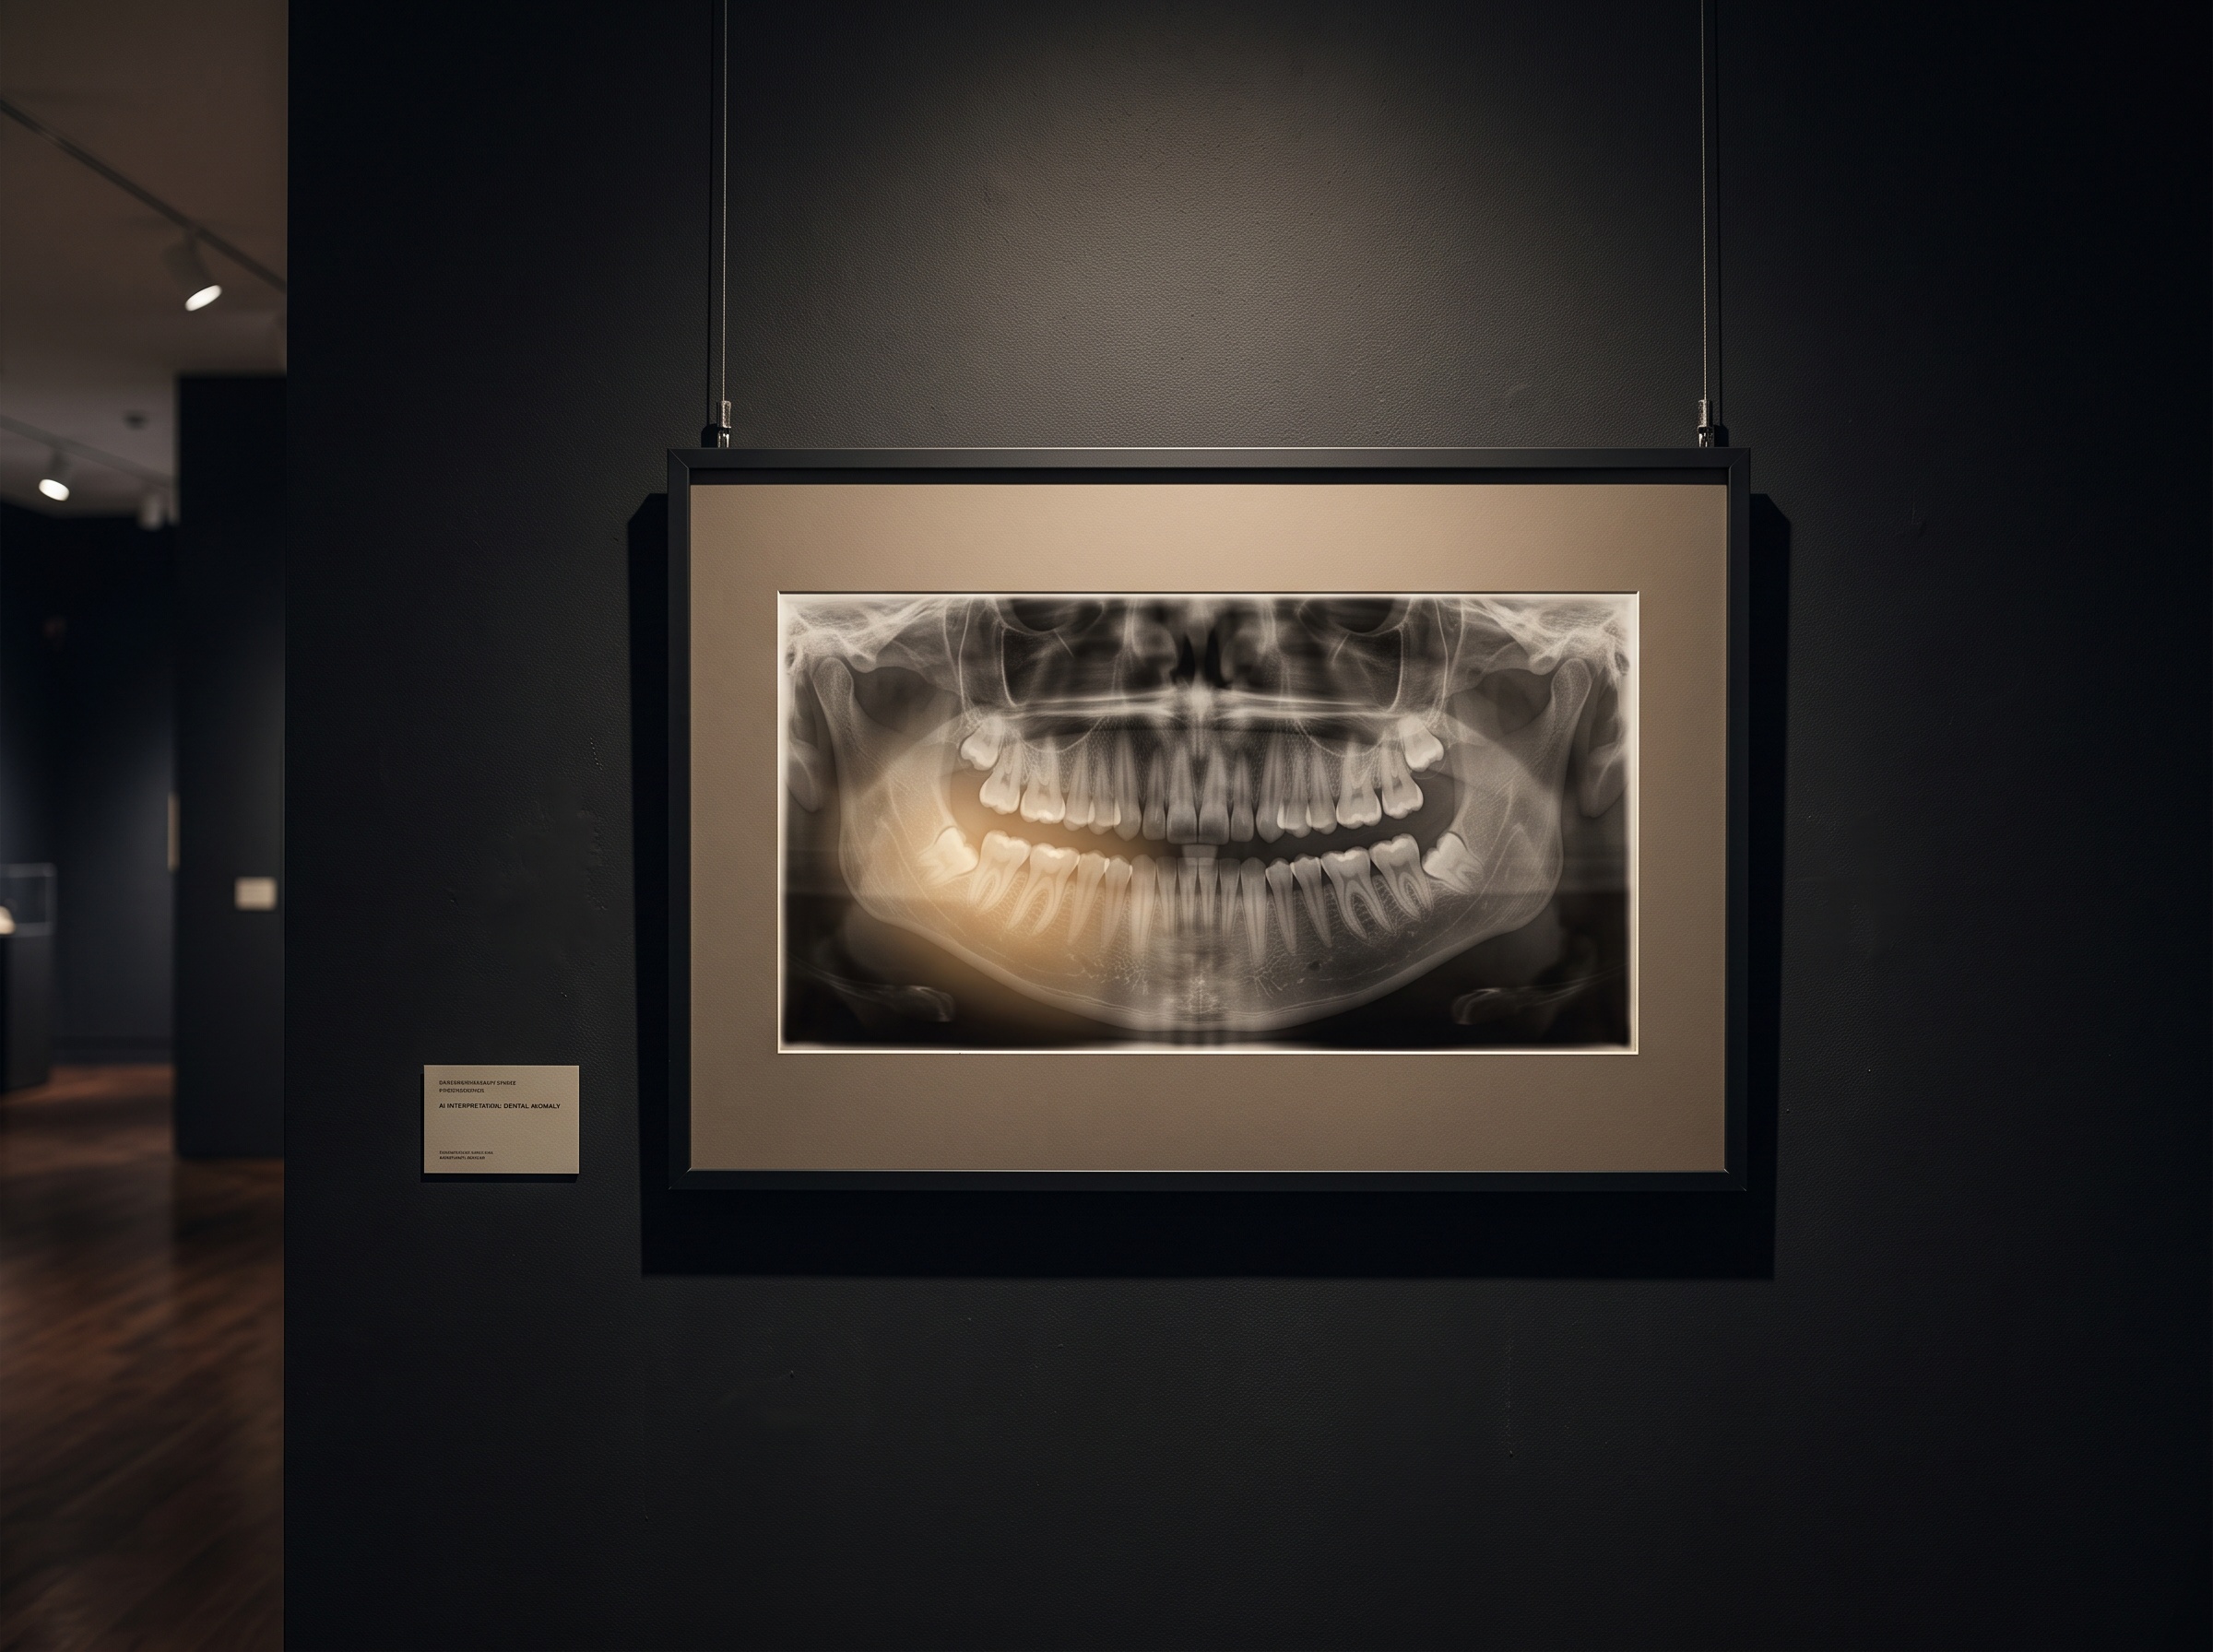
The best contemporary overlays have absorbed the rainbow’s lesson. They favor a single-hue wash that brightens with confidence, so that intensity – not an arbitrary journey through the spectrum – carries the meaning, and they are increasingly chosen to remain legible to the significant fraction of readers with color-vision deficiency, for whom a red-green rainbow is not a scale at all but a smear.
Reading the Costume, Not Just the Body
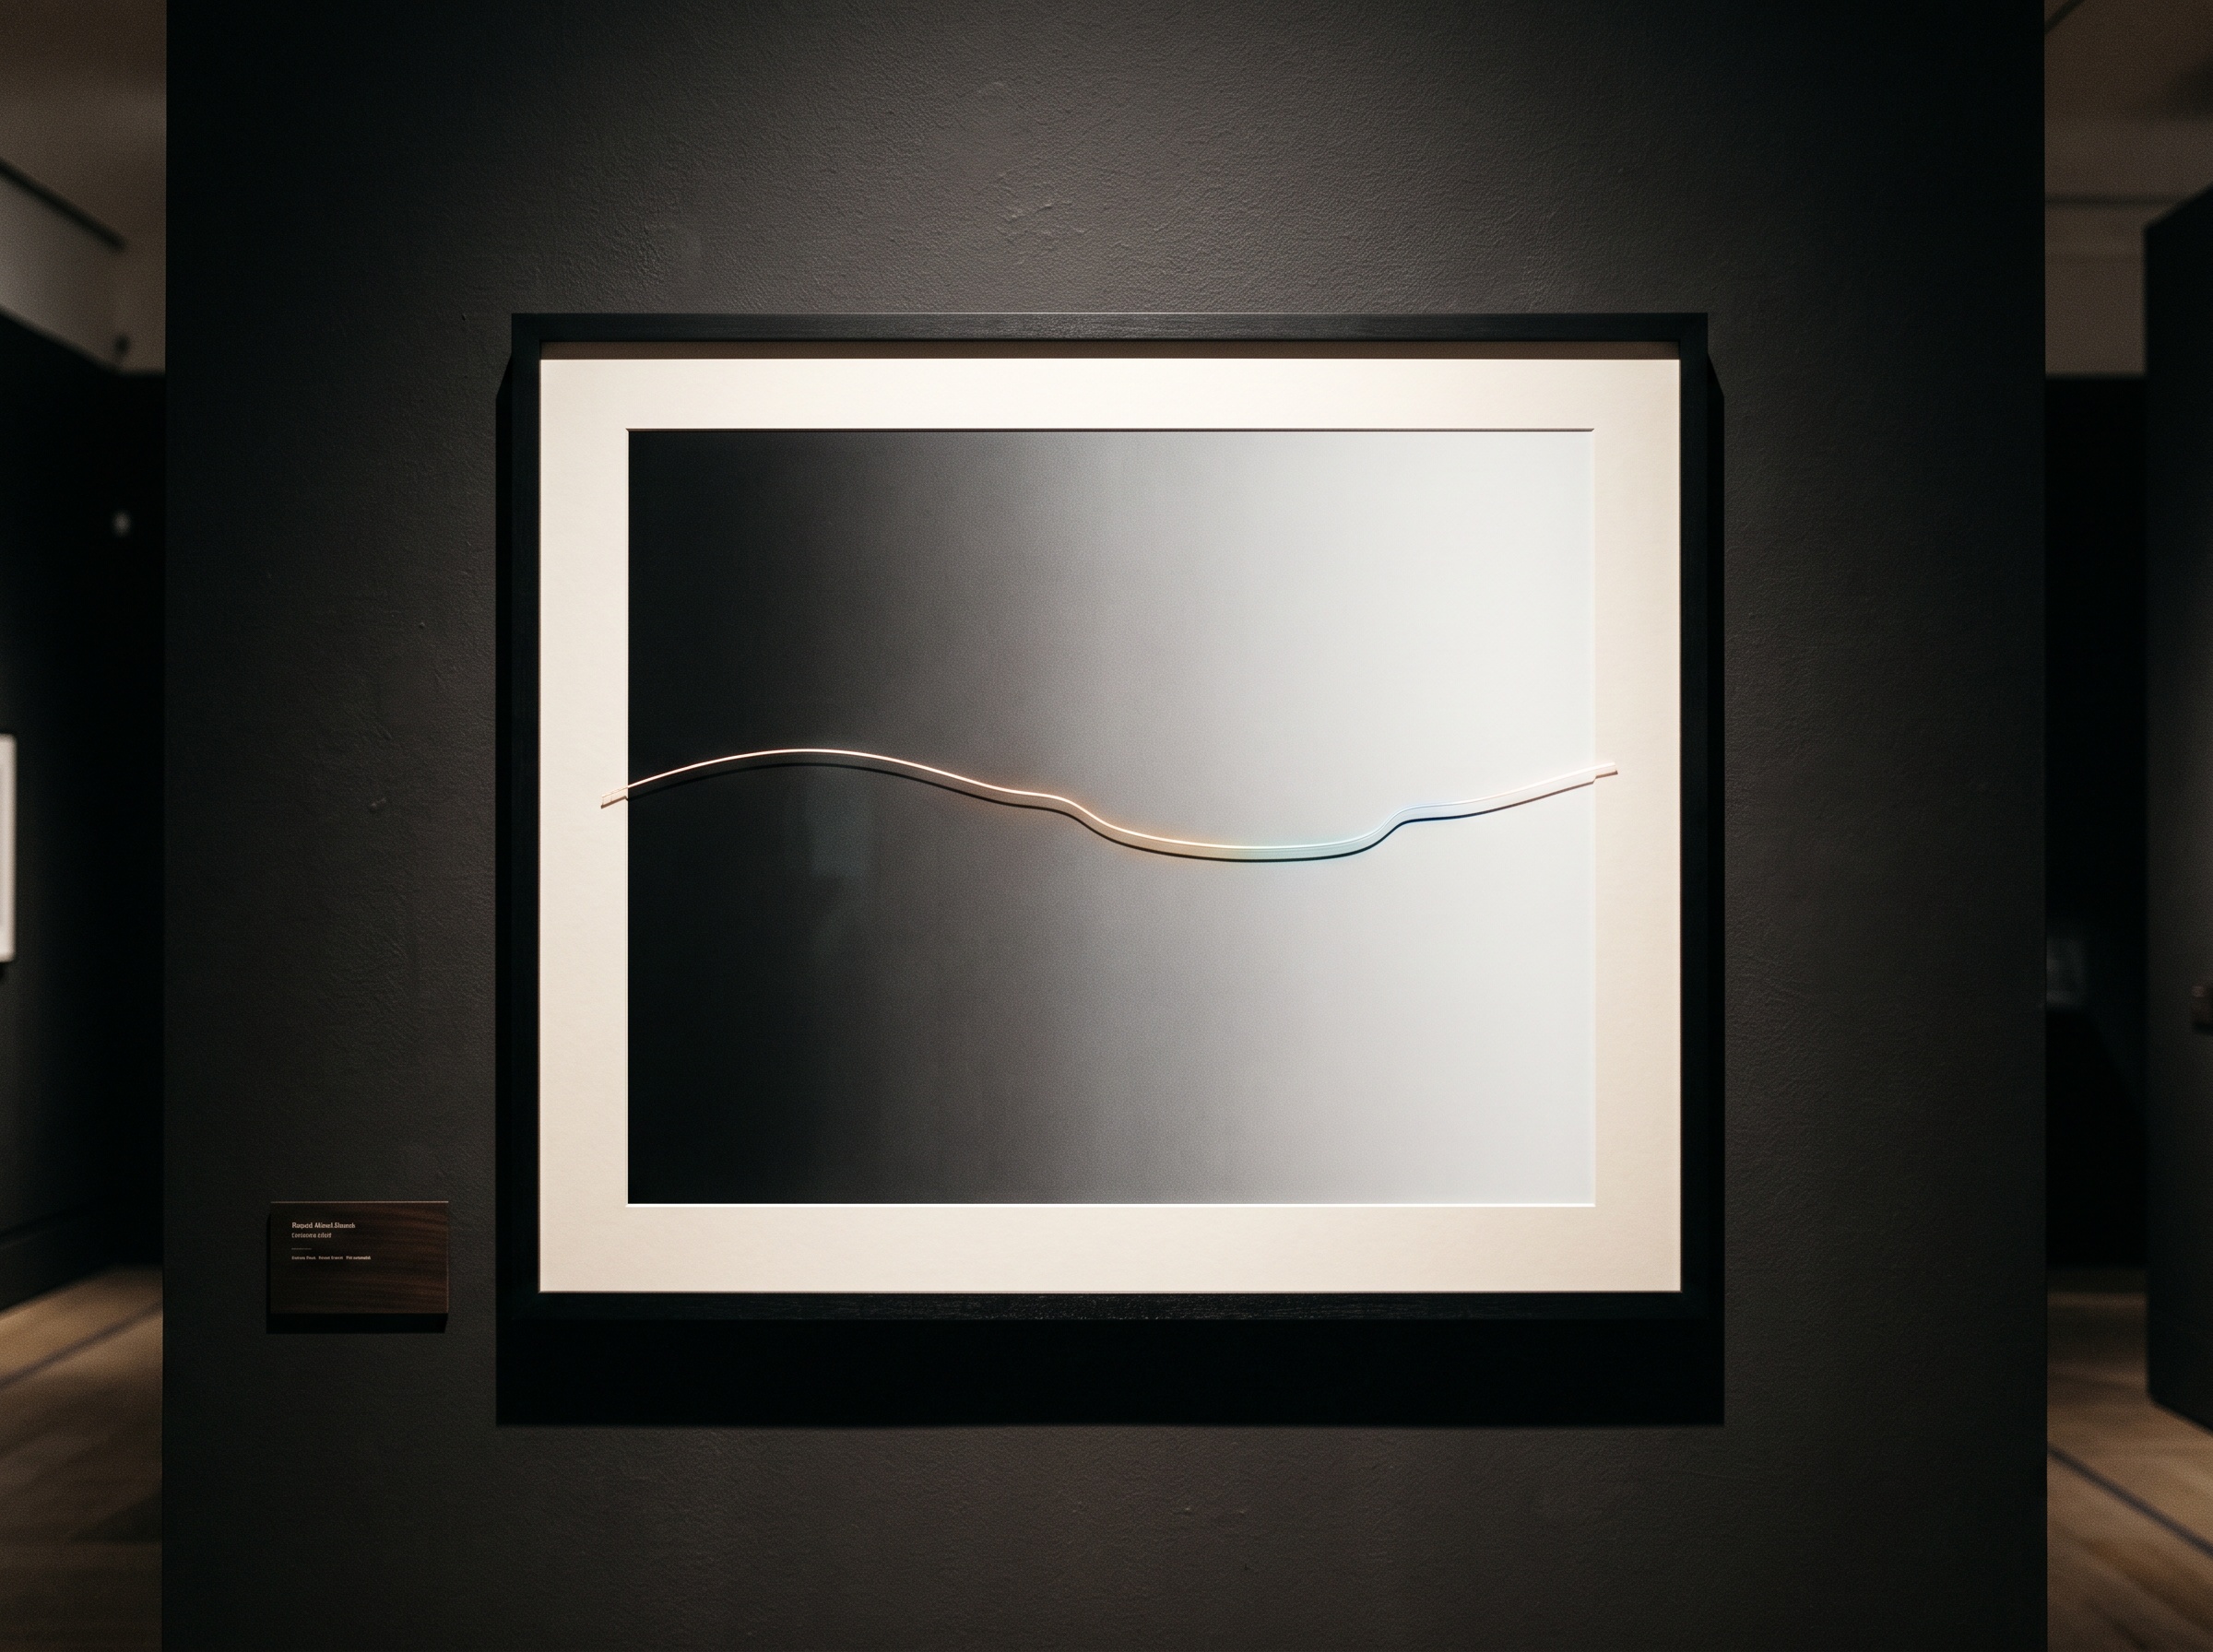
For the clinician, the practical lesson is a habit of mind: when an image arrives in color, read the colormap before you read the anatomy. Ask what scale is in use, whether it is perceptually uniform or a legacy rainbow, whether a bright boundary is a genuine edge in the data or an artifact of the LUT’s uneven stride. Ask, with an AI overlay, what the color is actually encoding – probability, density, dose, temperature – and how much number sits beneath the most seductive hue. A false-colored image is two artifacts at once: the measurement, and the decision about how to dress it. The honest reader keeps both in view, exactly as one learns to separate the true color of a tooth from the screen’s imperfect rendering of it in the study of gamut and metamerism in tooth reproduction.
Future Developments
The near horizon is quietly encouraging. The rainbow is finally in retreat; perceptually uniform, colorblind-safe colormaps are becoming the silent default in the software that renders our images, so that the reveal happens without the fabrication. Beyond that lies the adaptive colormap – a scale that shapes itself to the specific distribution of a given dataset, spending its color budget where the diagnostically important differences actually live rather than wasting it on empty range. Further still, explainable-AI research is pushing overlays from a single confidence wash toward richer, calibrated visual languages that distinguish what a model saw from how sure it is, without letting vividness outrun evidence. Through all of it, the deeper truth holds: a grayscale image is a faithful, colorless record, and the moment we paint it we accept a share of authorship. Pseudocolor, at its best, is the curator’s art – lighting the work so the truth of it reaches the eye, and never inventing a truth that was not there.
Sources & further reading:
Sorry, the comment form is closed at this time.